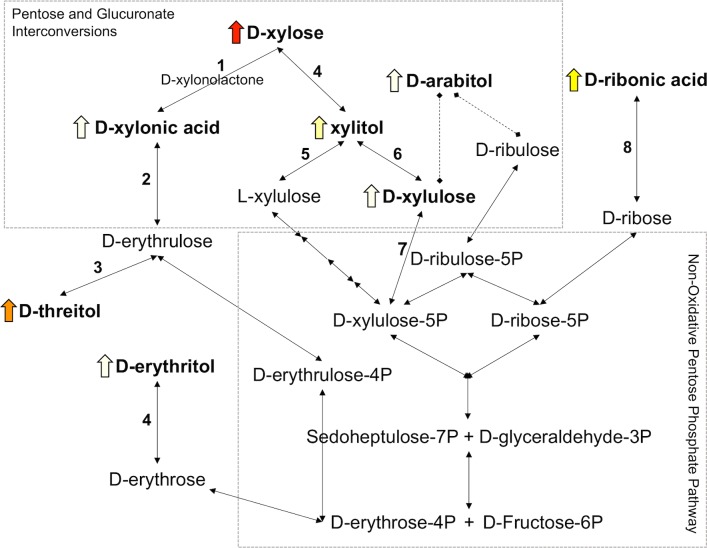
Fig 2. Proposed xylose metabolic pathway.
Dietary D-xylose concentration (0, 2, 4, or 8%) linearly increased the urinary excretion of the compounds in bold font (P < 0.0001). Non-bolded compounds were not detected in urine samples. The color of the block arrow indicates average excretion amount of the compound in pigs from the 8% xylose treatment; red: 40 g/d, orange: 13 g/d, yellow: 0.3 g/d, white: < 0.2 g/d. Solid connecting arrows represent reactions confirmed in mammals and dashed connecting lines represent presumed reactions based on reactions occurring in microorganisms. Highlighted enzymes: 1) D-xylose 1-dehydrogenase (1.1.1.179), 2) L-gulonate 3-dehydrogenase (1.1.1.45), 3) D-erythrulose reductase (1.1.1.162), 4) aldose/aldehyde reductase (1.1.1.21), 5) L-xylulose reductase (1.1.1.10), 6) xylitol dehydrogenase (1.1.1.14), 7) xylulokinase (2.7.1.17), and 8) D-ribose dehydrogenase (1.1.1.115). The boxes indicate KEGG metabolic pathway classifications [36].

