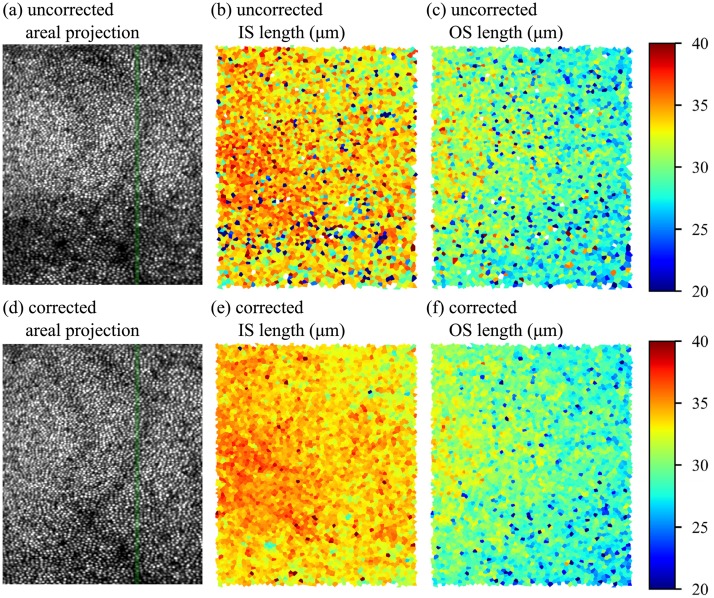
Fig 12. Axial lag bias reconstruction improves accuracy of cellular morphometry.
AO-OCT volumes permit many sorts of quantitative cellular morphological measurements. The curvature of the cone bands results in variations in en face projections of the cone mosaic along the slow (vertical) axis of the image, as shown in (a) and (d). The green line indicates the location of the slow-axis B-scans shown in Fig 11(a) and 11(e), respectively. Automated three-dimensional segmentation of inner (IS) and outer segments (OS) permits visualization of their lengths. Uncorrected IS and OS lengths are shown in (b) and (c), while corrected maps are shown in (e) and (f). While a ground-truth comparison is not possible, the corrected maps appear to suffer from fewer errors and bear better similarity to the smooth appearance of the layers in OCT B-scans and other morphometric studies [38]. The IS map (b) and (e), which requires localization of the relatively dim ELM, benefits especially from careful correction.

