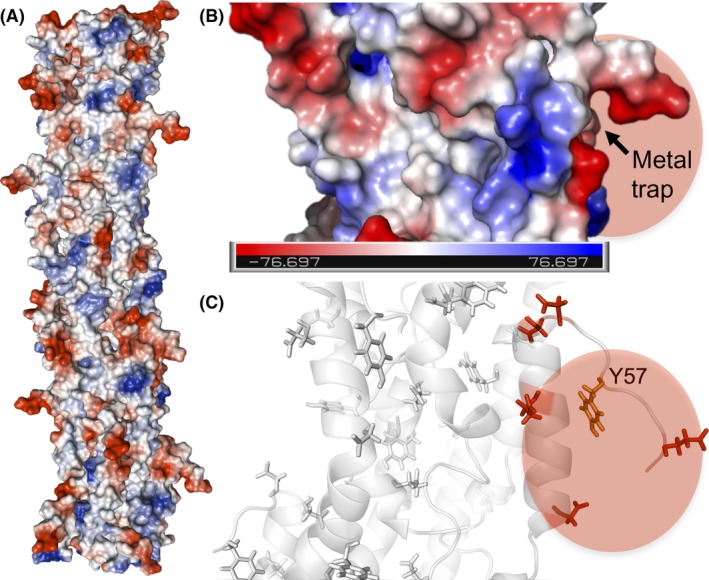
Figure 5.

(A‐B) Electrostatic potential (blue, positive; red, negative) map of a pilus fibre (A) and a 20‐Å closeup of a region with a metal trap (B). Colour bar in (B), Volts. (C) Molecular structure of the region around the metal trap highlighting in red the acidic side‐chains and, in orange, the terminal tyrosine (Y57) of the transversal electron transfer path.
