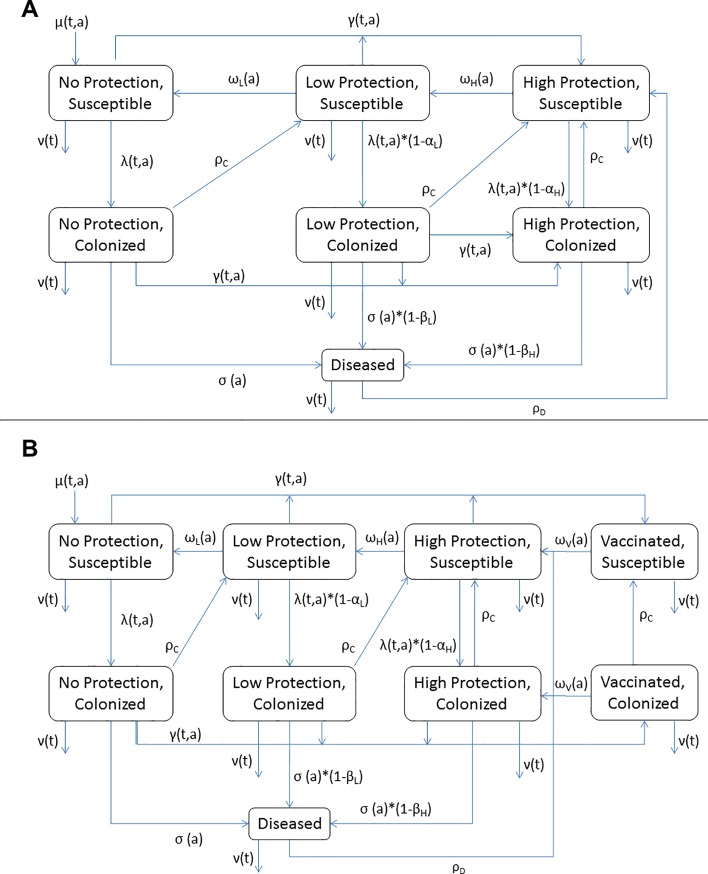
Fig 1.
Model structure for Base (A) and Vaccination-Plus (B) models. Each figure denotes movement within a given age stratum (aging process not shown). μ, birth rate; ν, death rate; γ, vaccination rate; other symbols as in Table 1. Subscripts t and a indicate parameters that vary with calendar time or age, respectively.

