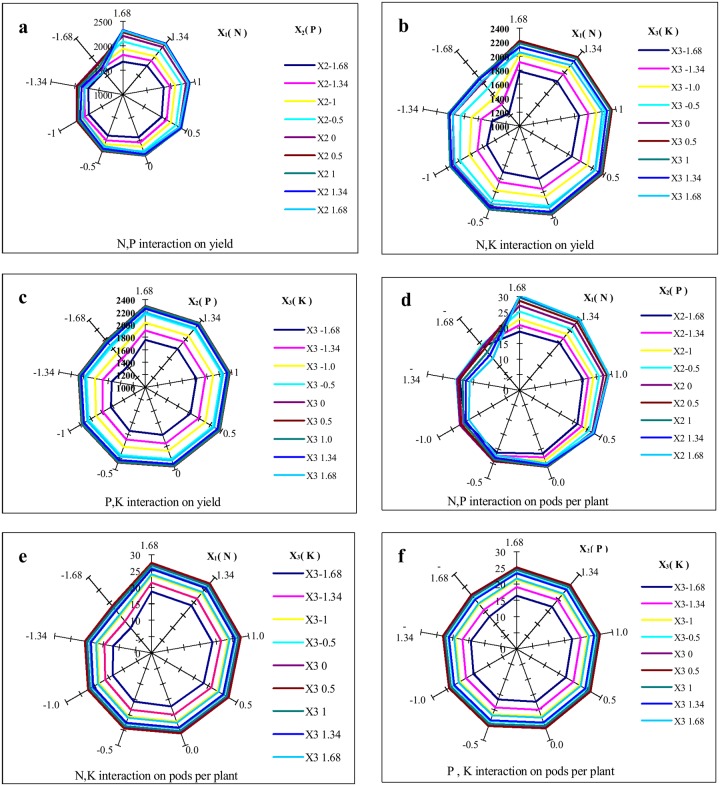
Fig 2. Effects of N(X1), P(X2), and K(X3) interactions on pods per plant and yield.
The radiation line represents the yield value (Y kg ha-1) and pods per plant. a. Effects of N and P fertilizer interaction on yield (X3 = 0). The radiation angle indicates N fertilizer levels and the series indicates the P fertilizer levels. b. Effects of N and K fertilizer interaction on yield (X2 = 0). The radiation angle indicates the N fertilizer levels and the series indicates the K fertilizer levels. c. Effects of P and K fertilizer interaction on yield (X1 = 0). The radiation angle indicates the P fertilizer levels and the series indicates the K fertilizer levels. d. Effects of N and P fertilizer interaction on pods per plant. The radiation angle indicates the N fertilizer levels and the series indicates the P fertilizer levels (X3 = 0). e. Effects of N and K fertilizer interaction on pods per plant. The radiation angle indicates the N fertilizer levels and the series indicates the K fertilizer levels (X2 = 0). f. Effects of P and K fertilizer interaction on pods per plant (X1 = 0). The radiation angle indicates the P fertilizer levels and the series indicates K fertilizer levels.

