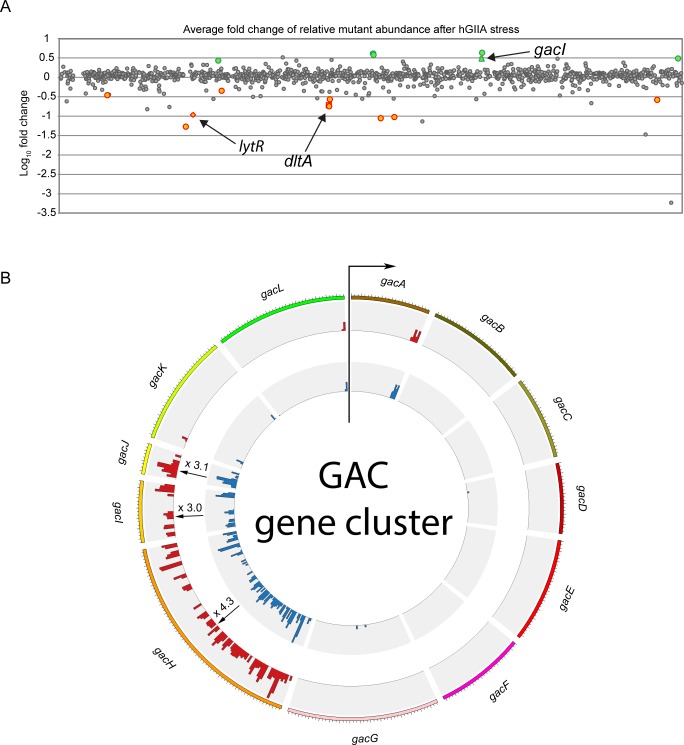
Fig 1. Identifying GAS mutants with different hGIIA susceptibility by Tn-seq analysis.
(A) Average log-fold change of transposon insertions in genes of the hGIIA-treated group versus the control group. Grey dots represent genes without significant fold change after hGIIA treatment. Green and orange dots represent genes with significantly increased and reduced transposon insertions after hGIIA exposure, respectively. Significant hits have a calculated BH corrected p <0.05. (B) Circos representation of the average transposon insertions of genes within the GAC gene cluster. All genes within this cluster, except for gacI, gacJ, and gacH, were previously identified as essential [39]. For gacI and gacH, the fold change shown is significant (BH corrected p ≤ 0.05), whereas for gacJ the fold change is not significant (BH corrected p = 0.16).

