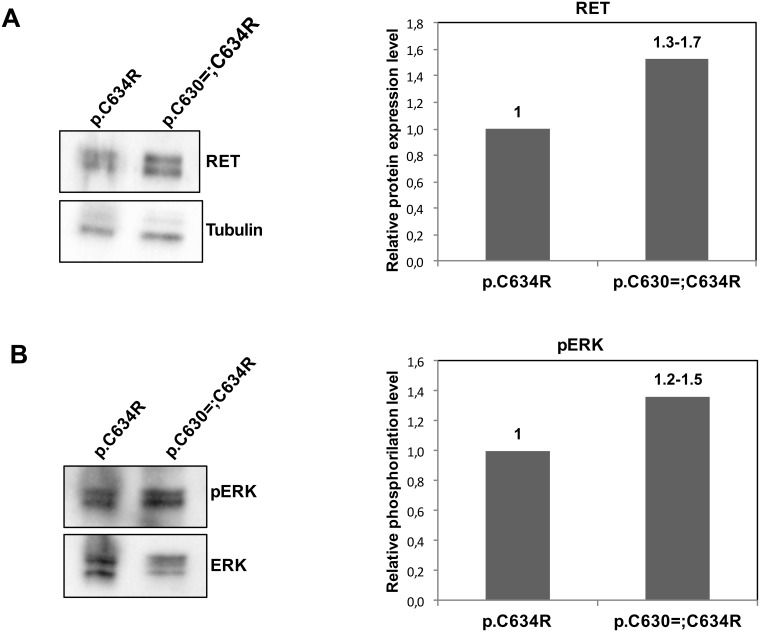
Fig 4. Expression and activation of RET protein in cervical lymph node metastases from p.Cys630=;Cys634Arg (patient ID0110M) and p.Cys634Arg MTCs (control).
Tissues from the two cases were subjected to: (A) Western blot analysis and quantification of RET levels relative to tubulin expression. (B) Western blot analysis and quantification of phosphorylated ERK protein (pERK) relative to ERK expression. The densitometric analyses in right panels shown the mean of two technical replicates of the Western Blot in left panels, the numbers above the column represent the range obtained in the two replicates.

