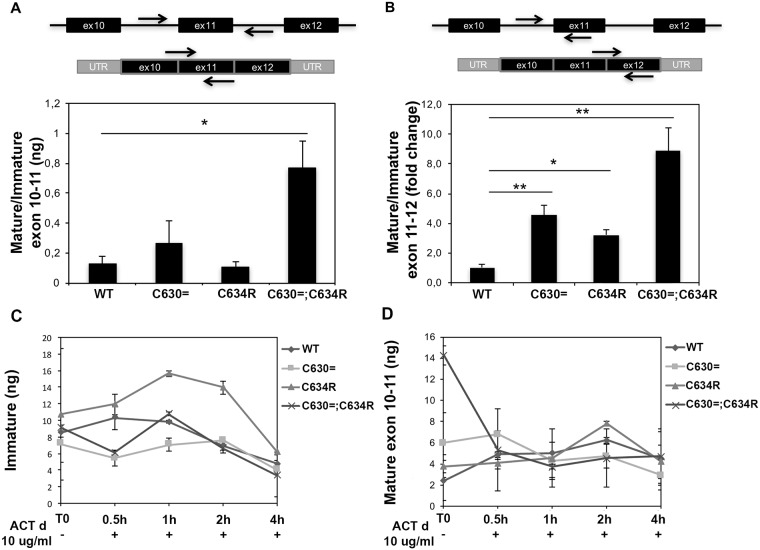
Fig 6. RET minigene transcript levels and stability in HeLa cells.
Expression levels of mature RET transcripts 24 h after their transfection into HeLa cells (A) Real-time PCR performed on exons 10–11 junction. Schematic representation of the primers for immature and mature RET transcripts was reported above the panel. Expression data, obtained using standard curves, are reported as the ratio between mature and immature transcript amounts. Data are shown as the mean of two biological replicates, error bars represent S.D. *P = 0.03 (t-test). (B) Real-time PCR performed on exon 11–12 junction. Schematic representation of the primers for immature and mature RET transcripts was reported above the panel. Relative expression levels of mature transcripts have been expressed as 2−ΔΔCt using immature transcript as normalizer and WT sample as calibrator. Data are shown as the mean of two biological replicates, error bars represent S.D. *P = 0.02 and **P = 0.019 (t-test). (C) Immature and (D) mature minigene transcript levels over time after the treatment with Actinomycin D.

