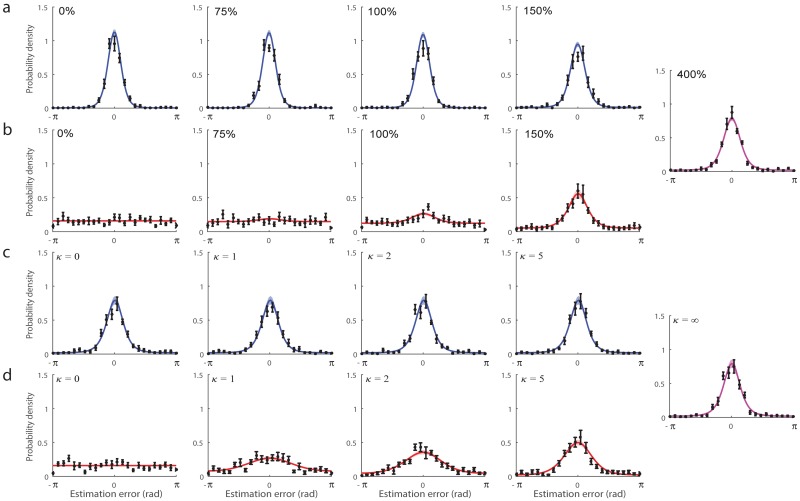
Fig 3. Recall errors and model fits.
(a & b) Consequences of varying internal noise (Experiment 1): different panels correspond to different levels of contrast for the variable noise stimulus. Error distributions are plotted for the low noise stimulus (a, blue) and variable noise stimulus (b, red). Data points and errorbars show empirical recall errors (mean ±1 SE). Colored curves and patches show predictions of the neural resource model with ML parameters (mean ±1 SE). A single plot is shown far right for the condition in which both stimuli had the same (low) noise. (c & d) Consequences of varying external noise (Experiment 2): plots as in (a & b).

