
Figure 4.
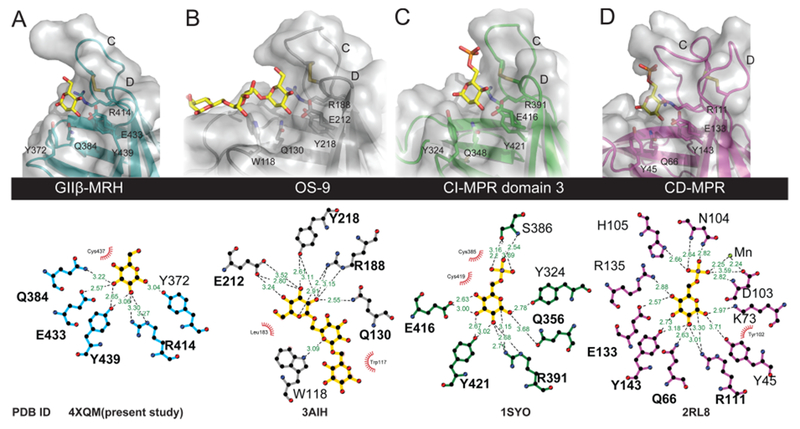
Comparison of ligand binding pockets of MRH domains. (A–D) Close-up view of the carbohydrate binding sites (top) of the MRH domains showing the four essential mannose binding residues along with the proposed glycosidic linkage-sensing tyrosine (Manα1,2Man) or tryptophan (Manα1,6Man). Ligands present in the determined structures are colored yellow. Molecular surfaces are shown over the ribbon models. The bottom panel was generated using LigPlot+52 and demonstrates the potential hydrogen bonding between the ligand and each of the MRH domains of the various proteins. Potential hydrogen bonding distances are colored green, and potential hydrophobic interactions are colored red. The PDB entries are listed for each structure (the bound structure of domain 5 was not included because the ligand is not refined).