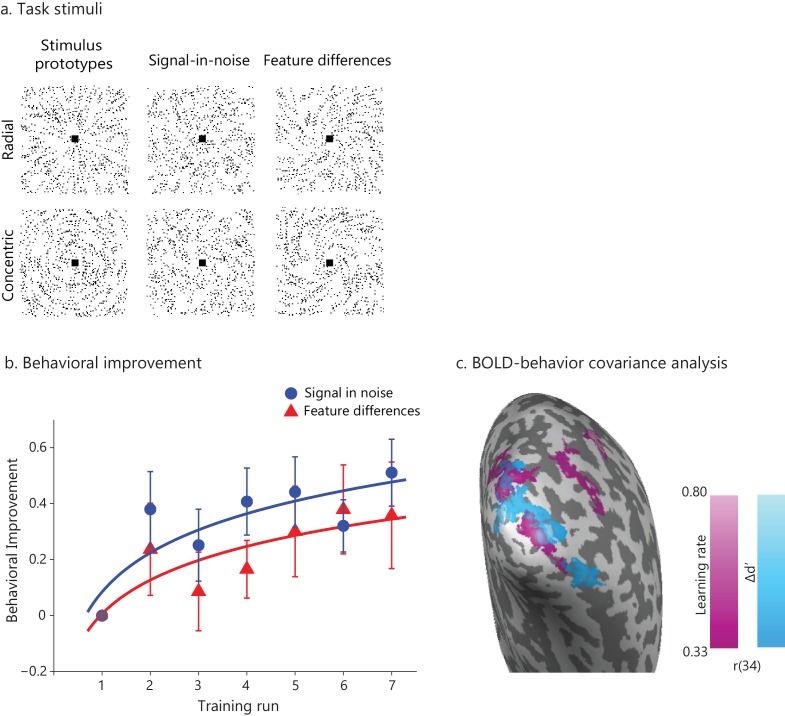
Figure 1. Learning-dependent changes in behavior and brain activation.
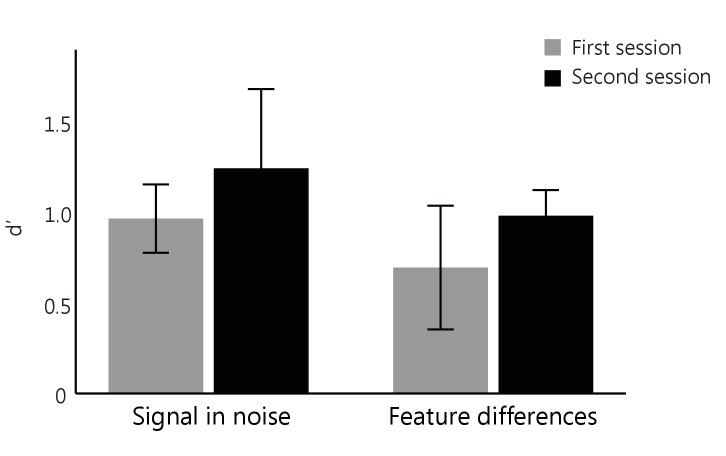
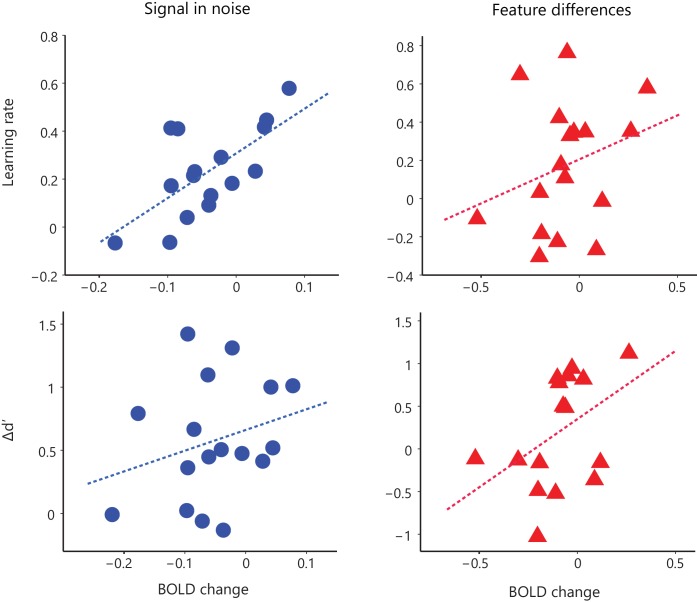
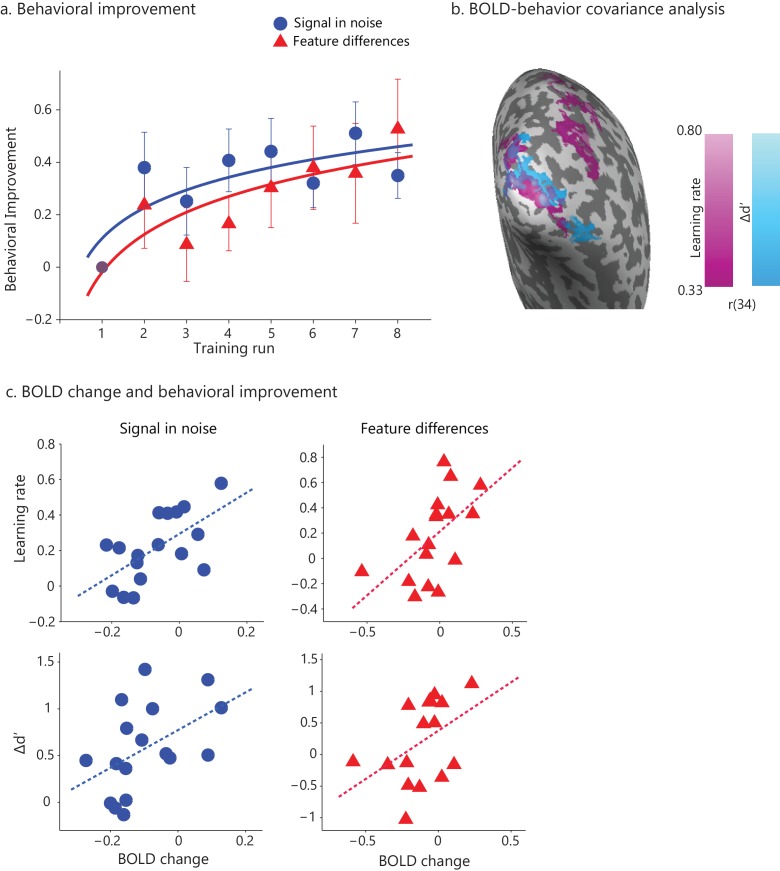
(a) Stimuli: Example stimuli comprising radial and concentric Glass patterns. Stimuli are shown for the Signal in noise task (25% signal, spiral angle 0° for radial and 90° for concentric) and the Feature-differences task version (100% signal, spiral angle 38° for radial and 52° for concentric). Prototype stimuli (100% signal, spiral angle 0° for radial and 90° for concentric) are shown for illustration purposes only. (b) Behavioral improvement during training: mean d’ per training run normalized to d’ in the first run. Data were fitted with a logarithmic function; error bars indicate standard error of the mean across participants. The trend of higher performance in the SN than the FD task was not statistically significant. No significant improvement was observed for a no-training control group who did not receive training in between test sessions (Figure 1—figure supplement 1). (c) Whole-brain covariance analyses (cluster threshold corrected, p<0.05) with either learning rate (magenta) or Δd’ (blue) on fMRI data (first two runs vs. last two runs) that were pooled across the two tasks showed positive significant clusters in the posterior occipito-temporal cortex. Activations are shown on the cortical surface of the right hemisphere (sulci are shown in dark grey, gyri in light grey). The color bar indicates Pearson’s r correlation values. Figure 1—figure supplement 3 illustrates the relationship between BOLD change extracted from this region and measures of behavioral improvement (learning rate, Δd’) per task. Significant activations were observed in bilateral occipito-temporal cortex and fronto-parietal regions (Figure 1—source data 1). Further, GLM analysis of the fMRI data across training runs showed significant changes in occipito-temporal BOLD for both tasks (Figure 1—figure supplement 2). For all figures, data are included for the same training duration across participants (i.e. seven runs), as several participants (n = 9) were missing data from the eighth run. Including data from participants that were trained for an additional eighth run (Figure 1—figure supplement 4a) showed similar results as the analysis including seven training runs from all participants; that is, the whole brain covariance analysis of BOLD change with behavioural improvement showed similar activation maps (Figure 1—figure supplement 4b,c).


