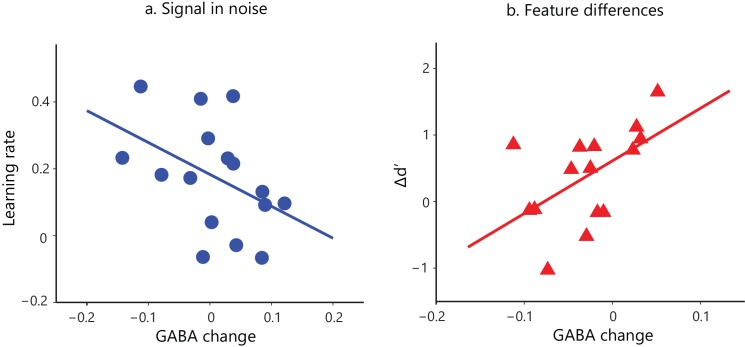
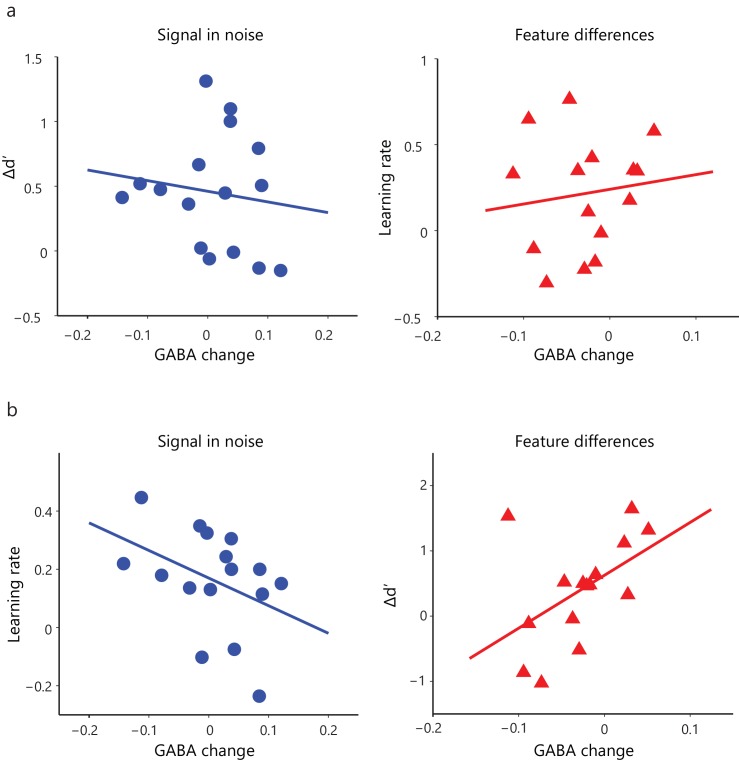
Figure 2. Task-dependent correlations of GABA change and behavioral improvement.
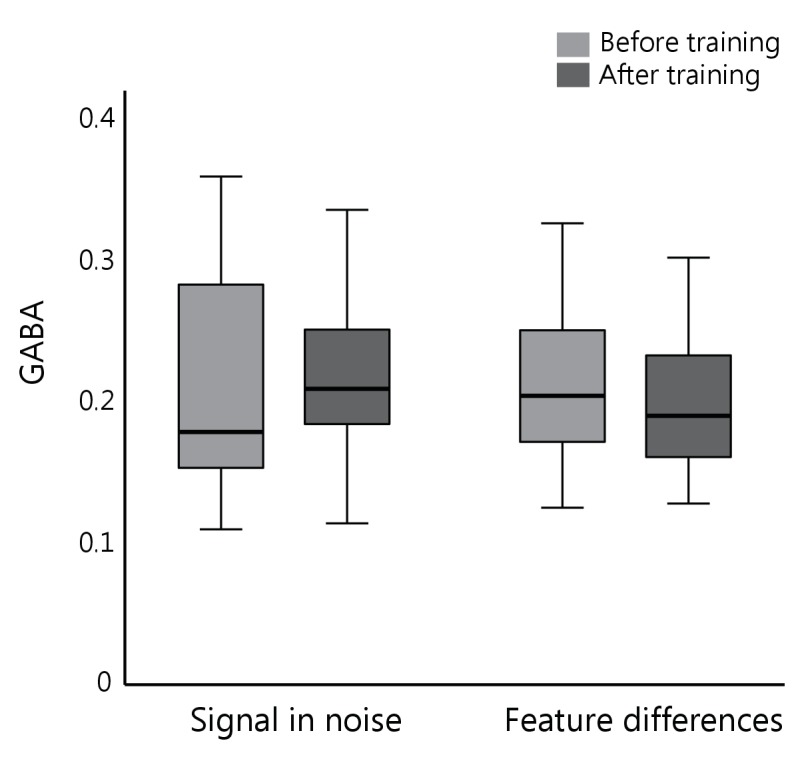
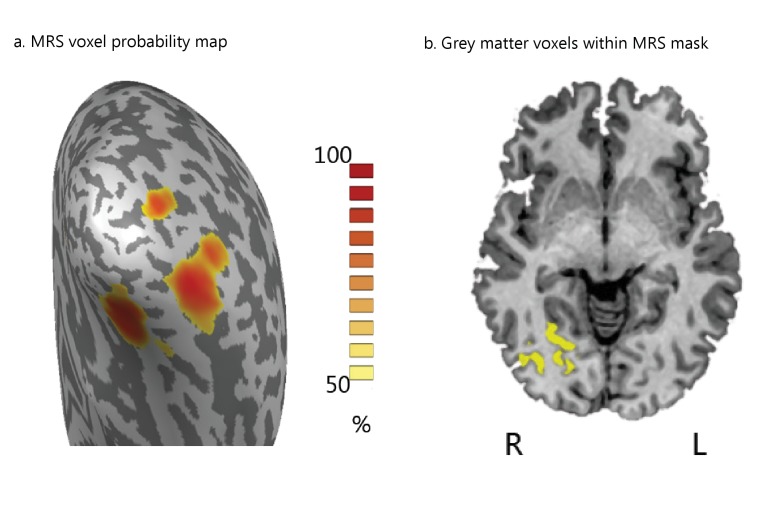
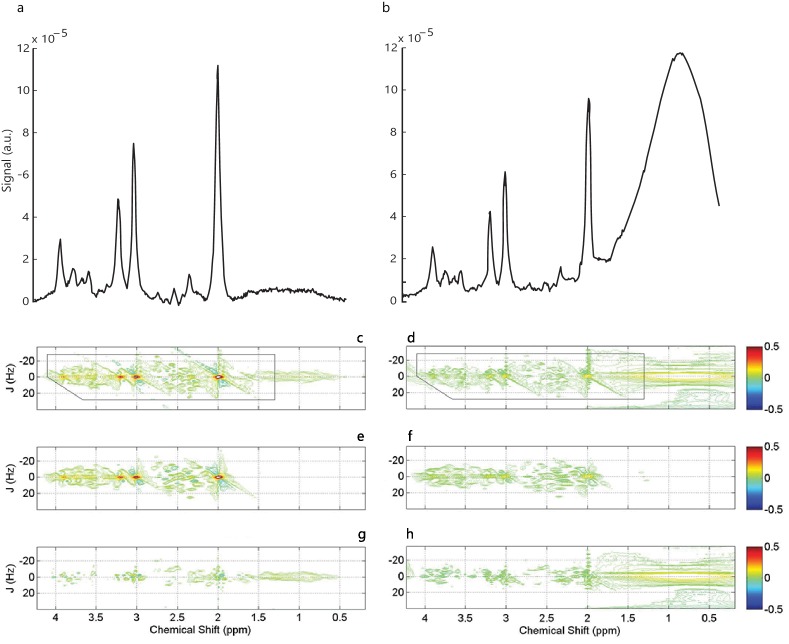
We measured MRS GABA in the posterior occipito-temporal cortex (Figure 2—figure supplement 1). We pre-processed and fit the data with ProFit (Schulte and Boesiger, 2006). We excluded three participants (FD task) due to fat contamination in the spectra (Figure 2—figure supplement 2). We did not observe significant differences in mean GABA concentration in occipito-temporal cortex before vs. after training (Figure 2—figure supplement 3). Here, we show skipped Pearson’s correlations indicating (a) a significant negative correlation of GABA change in occipito-temporal cortex with learning rate for the Signal-in-noise task (r = −0.43, CI=[−0.74,–0.07]) and (b) a significant positive correlation with Δd’ for the Feature-differences task (r = 0.54, CI=[0.05,0.85]). Correlations of GABA change with Δd’ for the Signal-in-noise task or learning rate for the Feature-differences task were not significant (Figure 2—figure supplement 4a). Negative learning rate or negative Δd’ represents decreased sensitivity during training. As participants were trained only for a single training session and without trial-by-trial feedback, these measures may be noisier and result in negative values. Correlations of GABA change with behavioral improvement remained significant when we removed data from participants with negative learning rate or Δd’. Further, including data from participants that were trained for an additional eighth run showed similar results: the correlations of GABA change with behavioral improvement (learning rate computed with eight training runs; Δd’ (last vs. first training run) remained significantly different (Fisher’s z = 2.4, p=0.02) between tasks (Figure 2—figure supplement 4b).
Figure 2—figure supplement 1. MRS voxel placement.
Figure 2—figure supplement 2. Fat contamination.
Figure 2—figure supplement 3. GABA concentration before vs. after training.
