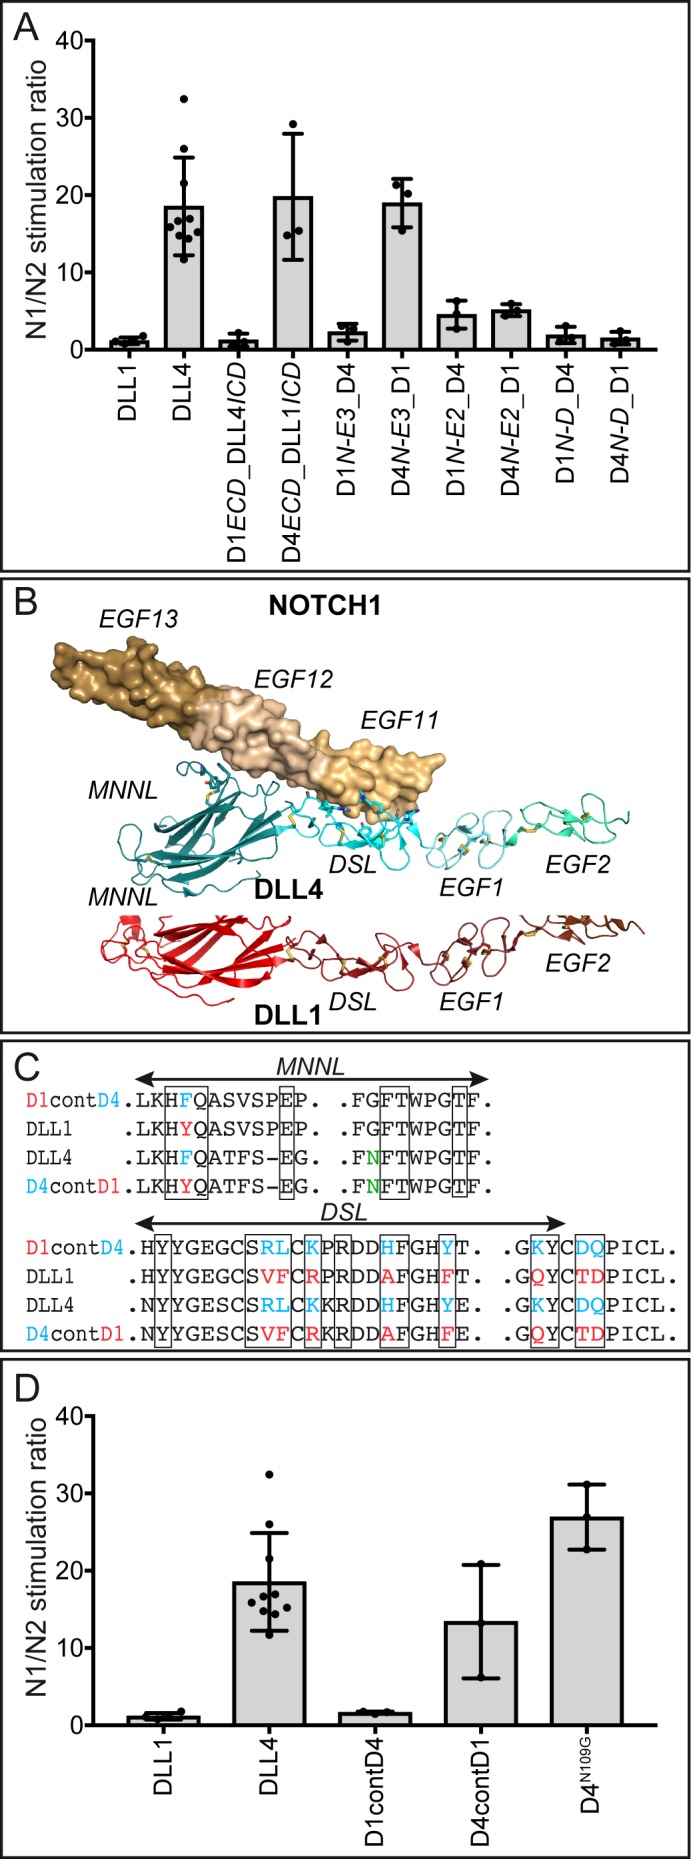
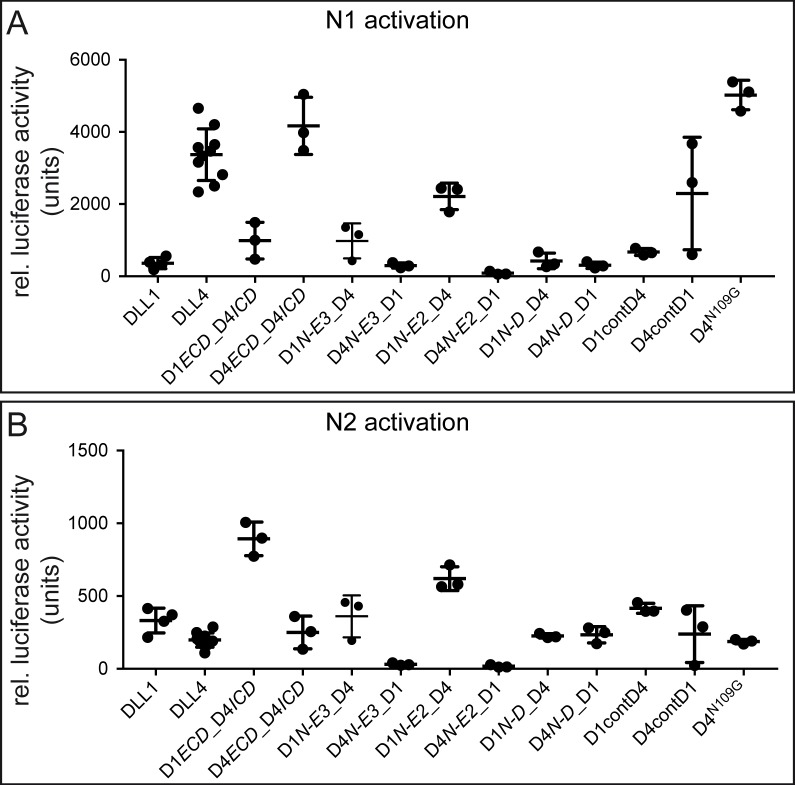
Figure 5. Contributions of the MNNL-EGF3 portion and contact amino acids to ligand selectivity towards N1 and N2.
(A) N1/N2 activation ratios by DLL1 and DLL4 chimeric proteins show that receptor selectivity of DLL1 and DLL4 is encoded by the extracellular domain and that EGF3 contributes to N1/N2 selectivity. DLL4, D4ECD_D1ICD, and D4N-E3_D1 show N1/N2 induction ratios of ~20. DLL1, D1ECD_D4ICD, and D1N-E3_D4 exhibit induction ratios of 1–3. Chimeric pairs with domain exchanges between EGF2 and EGF3 or between DSL domain and EGF1 show equivalent stimulation ratios. Each dot represents the mean of N1 (relative luciferase units; Figure 5—source data 1)/N2 (relative luciferase units; Figure 5—source data 2) of n ≥ 3 measurements per clone of a given ligand construct. Bars represent the Mean ± SD of n ≥ 3 clones per construct (Figure 5—source data 3). (B) Structure-based superposition of DLL1 and DLL4 (PDB ID codes 4XBM and 4XLW, respectively; (Kershaw et al., 2015; Luca et al., 2015). Top panel: NOTCH1 is rendered as a molecular surface (wheat), and DLL4 is rendered in ribbon representation (cyan). N1 contact residues on DLL4 were rendered as sticks, and were used to predict N1 contact amino acids of the MNNL and DSL domains of DLL1 (red). Domains are labeled above and below the structures, respectively, and individual domains are identified by different degrees of color shading/intensity. (C) Parts of the MNNL and DSL sequences showing the contact amino acids (boxed), the divergent amino acids of DLL1 (red) and DLL4 (blue), and the sequence of ligands with amino acid exchanges (complete sequences of the changed MNNL and DSL domains are shown in Figure 1—figure supplement 1B). The N-glycosylation site at residue N109 of DLL4 is indicated in green. (D) N1/N2 activation ratios of ligands with exchanged N1 contact amino acids. D1contD4 does not show changes in receptor selectivity compared to DLL1. Replacing the contact residues of DLL4 with those of DLL1 only reduces N1/N2 activation ratio to ~13. Elimination of the N-glycosylation site of DLL4 with the N109G mutation (the corresponding amino acid of DLL1) does not change DLL4 receptor selectivity. Each dot represents the mean of N1 (relative luciferase units; Figure 5—source data 1)/N2 (relative luciferase units; Figure 5—source data 2) of n ≥ 3 measurements per clone of a given ligand construct. Bars represent the Mean ± SD of n ≥ 3 clones per construct (Figure 5—source data 3).


