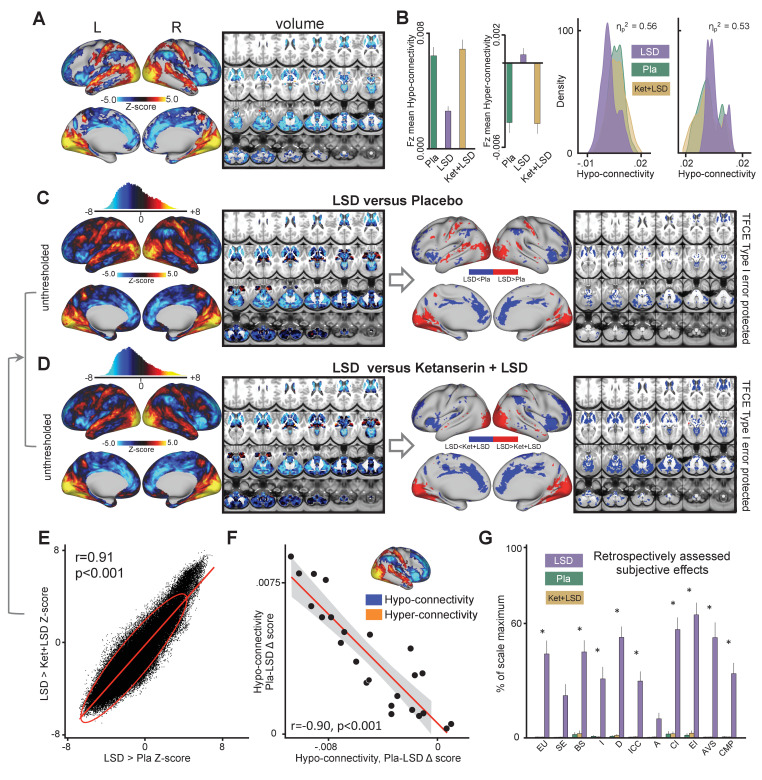
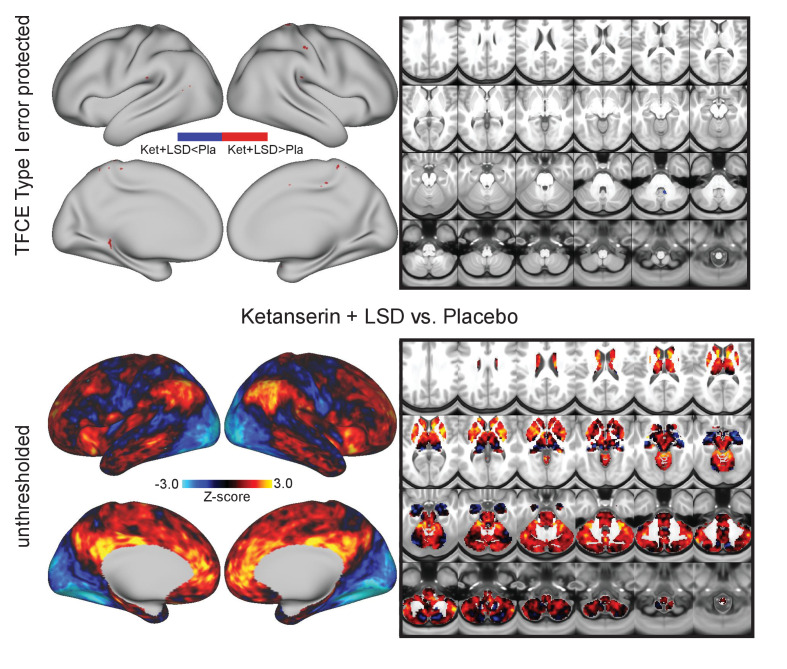
Figure 1. Effect of drug condition on global brain connectivity and subjective drug effects.
(A) Z-score map for the effect of LSD condition vs. (Ket+LSD)+Pla condition within areas showing a significant main effect of drug (TFCE type I error protected). Red/orange areas indicate regions where participants exhibited stronger GBC in the LDS condition, whereas blue areas indicate regions where participants exhibited reduced GBC condition, compared with (Ket+LSD)+Pla conditions. (B) Bar plots show mean connectivity strength (Fz) values for hyper- and hypo-connected areas averaged across grayordinates showing a significant main effect of drug. Distribution plots show distribution of Fz values within grayordinates showing significant hyper- and hypo-connectivity for LSD compared to (Ket+LSD)+Pla conditions. (C) Right panel displays significant (TFCE type I error protected) areas showing increased (red) and decreased (blue) GBC in the LSD condition compared to Pla. Left panel shows the corresponding unthresholded Z-score map. Red/orange areas indicate regions where participants exhibited stronger GBC in the LSD condition, whereas blue areas indicate regions where participants exhibited reduced GBC in the LSD condition, compared with Pla condition. The histogram above the map shows the distribution of Z-scores. (D) Right panel displays significant (TFCE type I error protected) areas showing increased (red) and decreased (blue) GBC in the LSD condition compared to Ket+LSD. Left panel shows the corresponding unthresholded Z-score map. Red/orange areas indicate regions where participants exhibited stronger GBC in the LSD condition, whereas blue areas indicate regions where participants exhibited reduced GBC in the LSD condition, compared with Ket+LSD condition. The histogram above the map shows the distribution of Z-scores. (E) Scatterplot showing a positive relationship between drug condition differences in GBC. Plotted are Z-scores for all grayordinates for the LSD>Placebo comparison (see panel C, X-axis) and LSD >Ket+LSD comparison (see panel D, Y-axis). Ellipse marks the 95% confidence interval. (F) Scatterplot showing significant negative relationship evident between averaged hyper- and hypo- connected grayordinates (based on the LSD vs. (Ket+LSD)+Pla contrast, see Figure 1A and inlet) across subjects (black data points) for Pla–LSD condition change scores. Grey background indicates the 95% confidence interval. (G) Retrospectively assessed (720 min after second drug administration) subjective drug-induced effects. Effects were assessed with the Five Dimension Altered States of Consciousness Questionnaire. EU: Experience of Unity; SE: Spiritual Experience; BS: Blissful State; I: Insightfulness; D: Disembodiment; ICC: Impaired Control and Cognition; A: Anxiety; CI: Complex Imagery; EI: Elementary Imagery; AVS: Audio-Visual Synesthesia; CMP: Changed Meaning of Percepts. N = 24. * indicates significant difference between LSD and Pla, and LSD and Ket+LSD drug conditions, p<0.05, Bonferroni corrected.


