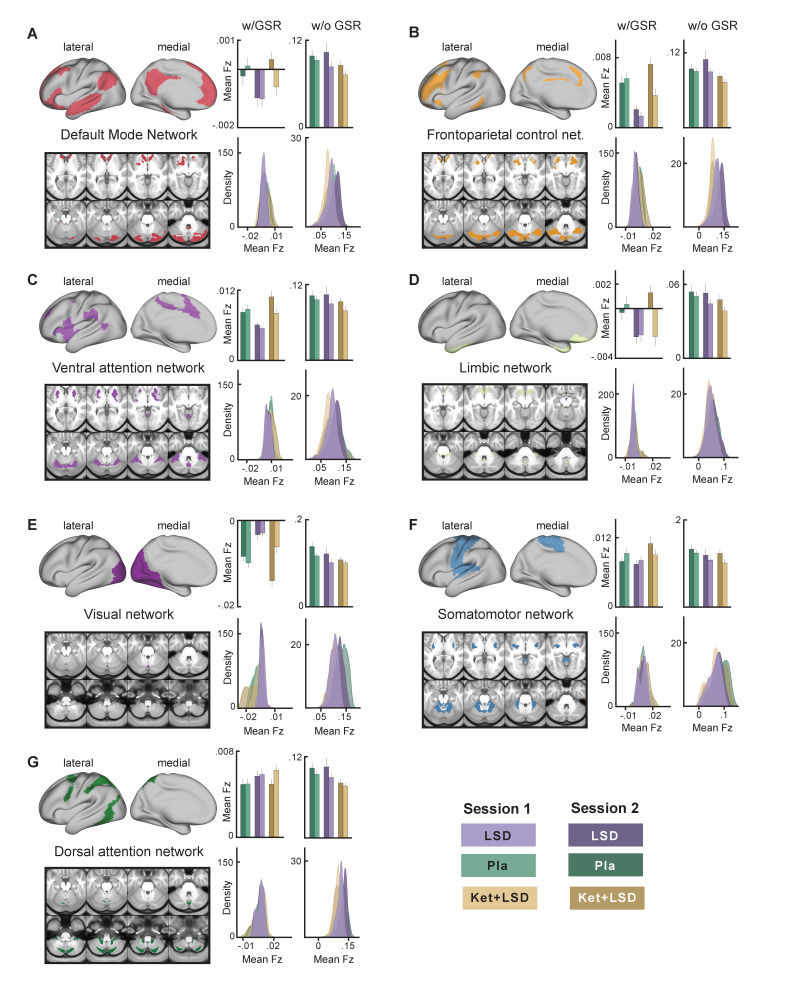
Figure 7. Effect of drug condition, session, and globals signal regression on global brain connectivity in functional networks (A–G).
Brain maps illustrate lateral, medial, and subcortical view of functional networks. Bar plots show mean connectivity strength (Fz) values for grayordinateswithin functional networks for Pla, LSD, and Ket+LSD conditions, for session 1 and session two respectively, as well as with and without GSR. Distribution plots show distribution of connectivity strength (Fz) values for grayordinates within functional networks for Pla, LSD, and Ket+LSD conditions, for session 1 and session 2 respectively, as well as with and without GSR. N = 24.

