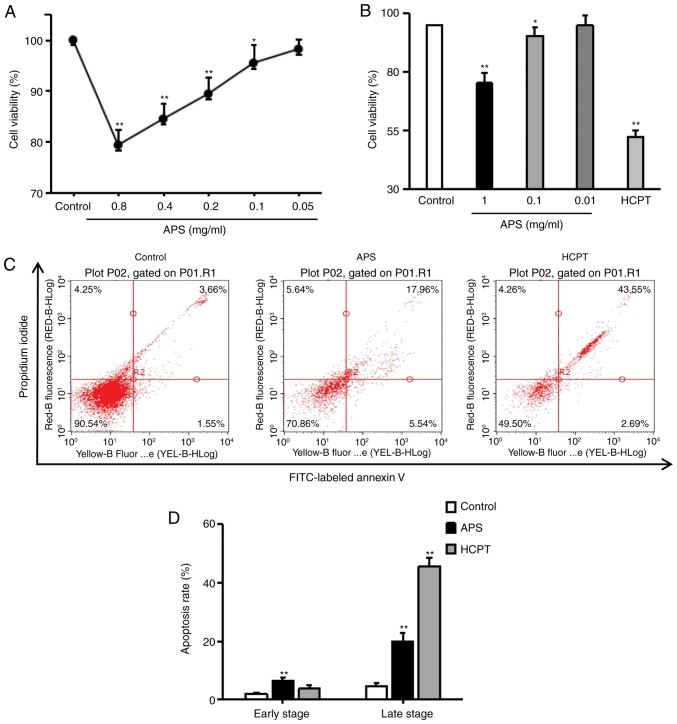
Figure 2.
Effects of APS and HCPT on the viability and apoptosis of H1299 cells. Viability of H1299 cells was determined via MTT assay. (A) H1299 cells were exposed to the indicated concentrations of APS, and (B) the indicated concentrations of APS or 1 µM HCPT for 24 h. Each point represents the mean ± standard error of the mean of three independent experiments. (C) H1299 cells were treated with 0.4 mg/ml APS or 1 µM HCPT for 24 h, and the apoptotic response was analyzed by FACS analysis of Annexin V/propidium iodide double-stained cells. (D) Graph showing the results of apoptisis. Data are representative of two independent experiments. APS, Astragalus polysaccharide; HCPT, 10-hydroxycamptothecin; FITC, fluorescein isothiocyanate. *P<0.05 and **P<0.01, vs. untreated control.

