Figure 8.
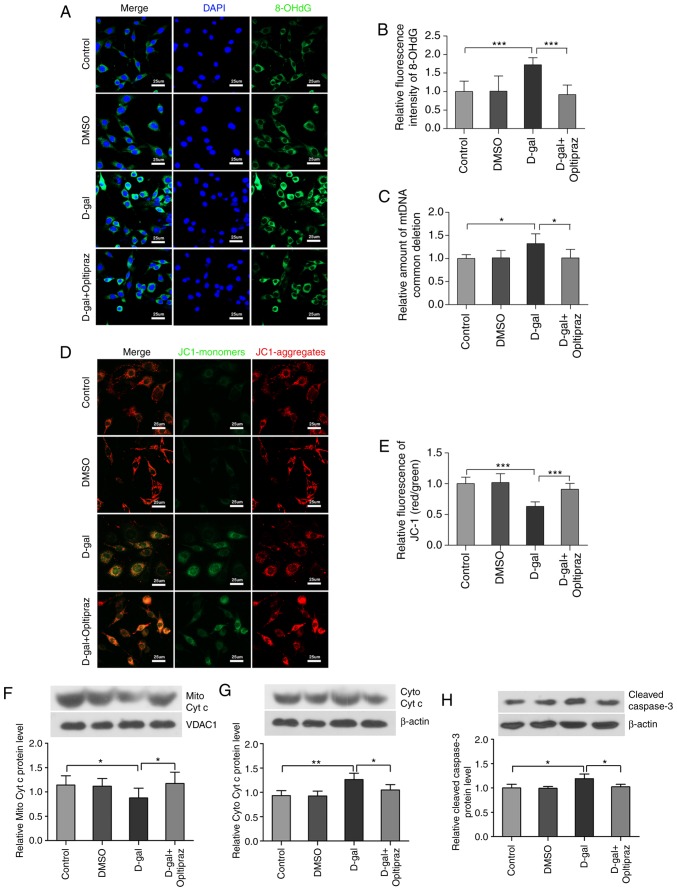
Oltipraz inhibits D-gal-induced 8-OHdG formation, mtDNA CDs and mitochondrial dysfunction. (A) Representative confocal images of 8-OHdG. (B) Quantitative assessment of 8-OHdG fluorescence in the treated cells. (C) Levels of mtDNA CDs in the treated cells were analyzed by TaqMan quantitative polymerase chain reaction. (D) Representative images of JC-1. The red colour indicates the JC-1 aggregate fluorescence from healthy mitochondria, the green colour indicates cytosolic JC-1 monomers, merged images indicate the co-localization of JC-1 aggregates and monomers. (E) Quantitative assessment of JC-1 fluorescence. The results show the ratios of red to green JC-1 mean fluorescence intensities in different groups. Western blot analysis of (F) Mito Cyto c and (G) Cyto Cyt c levels. (H) Western blot analysis of cleaved caspase-3 levels. For all experiments, *P<0.05, **P<0.01 and ***P<0.001. The data are presented as the mean ± standard deviation. D-gal, D-galactose; 8-OHdG, 8-hydroxy-2'-deoxyguanosine; Mito Cyt c, mitochondrial cytochrome c; Cyto Cyt c, cytosolic cytochrome c; CD, common deletion; DMSO, dimethyl sulfoxide.

