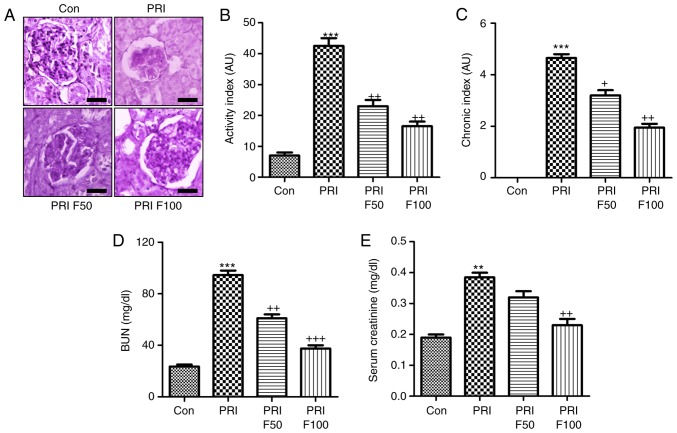
Figure 2.
Effects of fisetin on nephritis in SLE models. (A) Histological PAS staining of glomeruli in PRI-induced mice. Representative images are displayed. Scale bar=50 µm. (B) The activity index for each group was determined from the PAS-stained tissue sections. (C) The chronicity index of PAS-stained renal tissue sections was measured. (D) Serum BUN and (E) creatinine were examined. Values are expressed as the mean ± standard error of the mean (n=10 in each group). ***P<0.001 vs. the Con group; +P<0.05, ++P<0.01 and +++P<0.001 vs. the PRI group. Con, control; PRI, pristine; PAS, periodic acid-Schiff; BUN, blood urea nitrogen; F50/100, treatment with 50/100 mg/kg fisetin.

