
Figure 9.
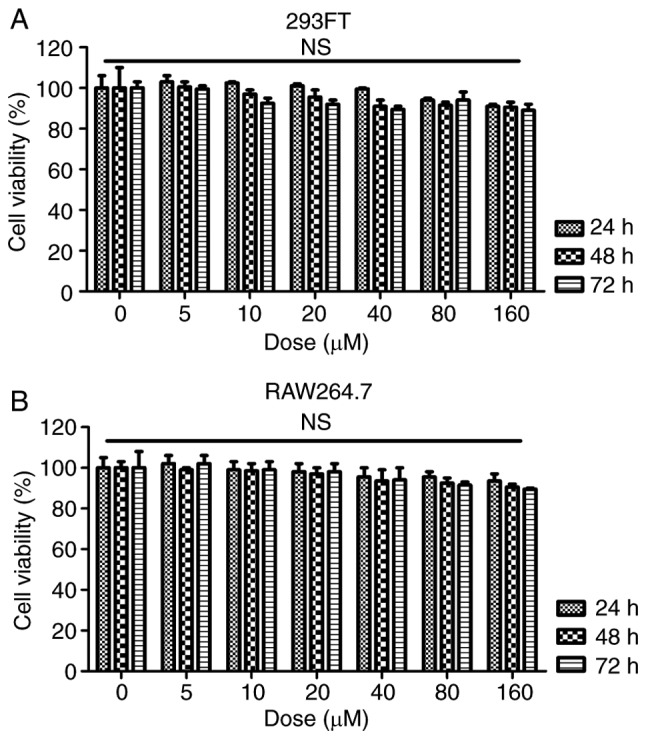
Analysis of the effects of fisetin in vitro. (A) The 293FT and (B) the RAW264.7 mouse macrophage cell line were treated with different concentrations of fisetin (0, 5, 10, 20, 40, 80 and 160 µM) for 24, 48 or 72 h. The MTT assay was used to determine the cell viability. n.s., no significant difference.