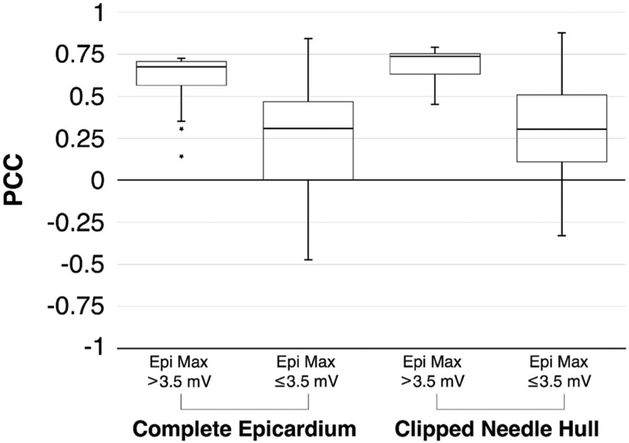
FIGURE 7.
PCC Reliance on Ischemic Stress. Box plots for both coverage regions, Complete Epicardium and Clipped Needle Hull, show that consistently high correlation between measured and simulated solutions is dependent on the level of ischemic stress experienced by the heart as defined by level of maximum epicardial ST40% value.

