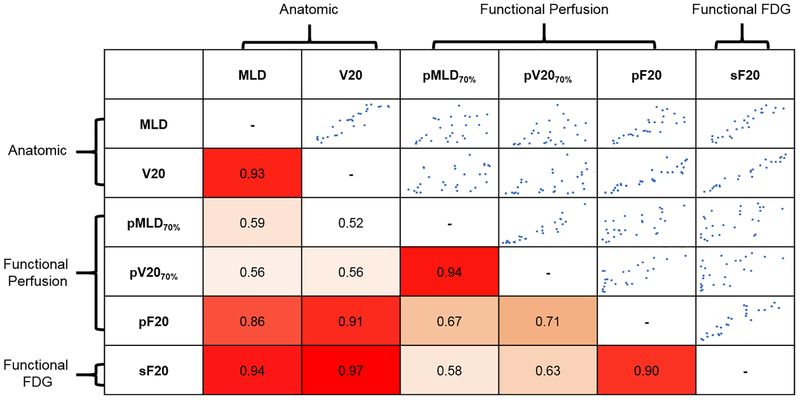
Figure 1: Inter-parameter Spearman rank correlation coefficients for predictors of GR2+ PNM.
White indicates low correlation. Orange indicates moderate correlation. Red indicates strong correlation. Anatomic dose parameters MLD and V20 correlate strongly with each other. Both also correlate strongly with pF20 and sF20. pMLD and pV20 correlate strongly with each other but not with anatomic dosimetry. Scatter plots in the upper diagonal represent the pairwise relationship between variables that intersect in each cell to provide a visual representation of the strength of correlation mirrored across the diagonal.

