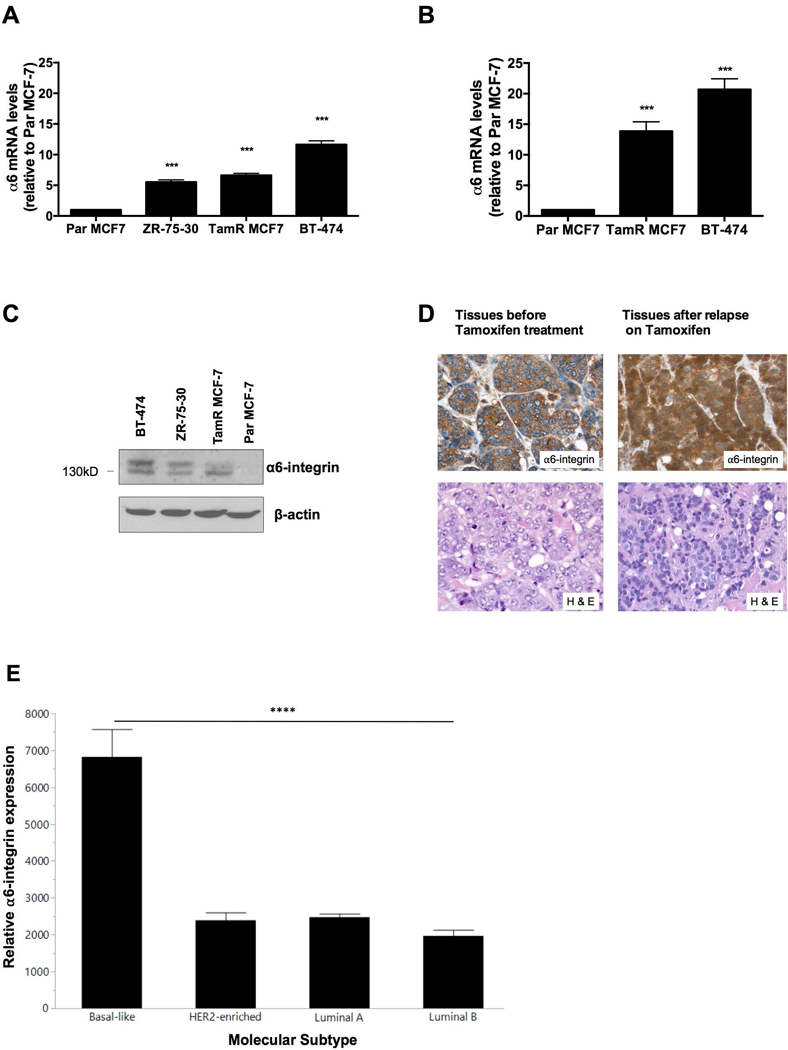
Figure 1. α6-integrin expression in tamoxifen-resistant breast cancer cells and breast tumor tissues.

(A) Endogenous α6-integrin mRNA expression was evaluated in Par MCF-7, TamR MCF-7, ZR-75–30 and BT-474 cells and (B) in Par MCF-7, TamR MCF-7 and BT-474 mammospheres. Data represent the mean of at least 3 independent experiments. Bars, SEM. Significantly different at ***P < 0.001 in comparison to Par MCF-7 cells or mammospheres. (C) Western blot revealing relative α6-integrin protein expression in Par MCF-7, TamR MCF-7, ZR-75–30 and BT-474 cells. (D) Representative α6-integrin IHC stains for treatment naïve patient tumor tissues (left) and patient tumor tissues following relapse on tamoxifen (right). Magnification 40X. (E) Bar graph depicting α6-integrin mRNA expression levels (Pam50 gene set) from different breast tumor types derived from the TCGA database. Bars, SD. Significantly different as denoted **** P < 0.0001 when comparing basal-like subtypes with luminal A, luminal B and Her2-amplified subtypes.
