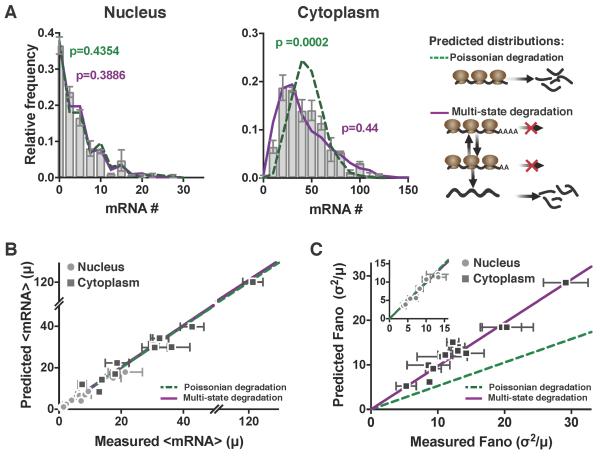
Figure 5: Cytoplasmic mRNA noise is further amplified by multi-state mRNA decay. See also Figure S5 and Figure S6.
(A) Representative smFISH probability distributions of nuclear and cytoplasmic HIV LTR–expressed mRNA in an isoclonal population of human T lymphocytes. Both the single-state Poissonian degradation model (dashed green line) and multi-state degradation model (solid purple line) fit the experimental probability distribution (bar graph) of nuclear mRNA levels (left column), but the mRNA distribution in the cytoplasm (middle column) is significantly wider than predicted from Poissonian degradation (dashed green line) and fits a multi-state super-Poissonian degradation model (solid purple line). Schematics of each degradation model are shown on the right. P values are from KS test to the experimental data.
(B) Both the super-Poissonian and Poissonian degradation models accurately predict nuclear (circles) and cytoplasmic (squares) mean mRNA levels – paired t-test p = 0.1623 and 0.3737 respectively.
(C) The Poissonian degradation model (dashed line) does not accurately predict the cytoplasmic mRNA noise – paired t-test p=0.0002. Only the super-Poissonian degradation model (solid line) accurately predicts both nuclear (circles–inset) and cytoplasmic (squares) mRNA noise – paired t-test p=0.1411 and 0.1623 respectively. Inset: both models accurately predict nuclear mRNA noise.
(B–C) All data points are mean of two biological replicates, and error bars represent SEM. Lines are linear regressions.

