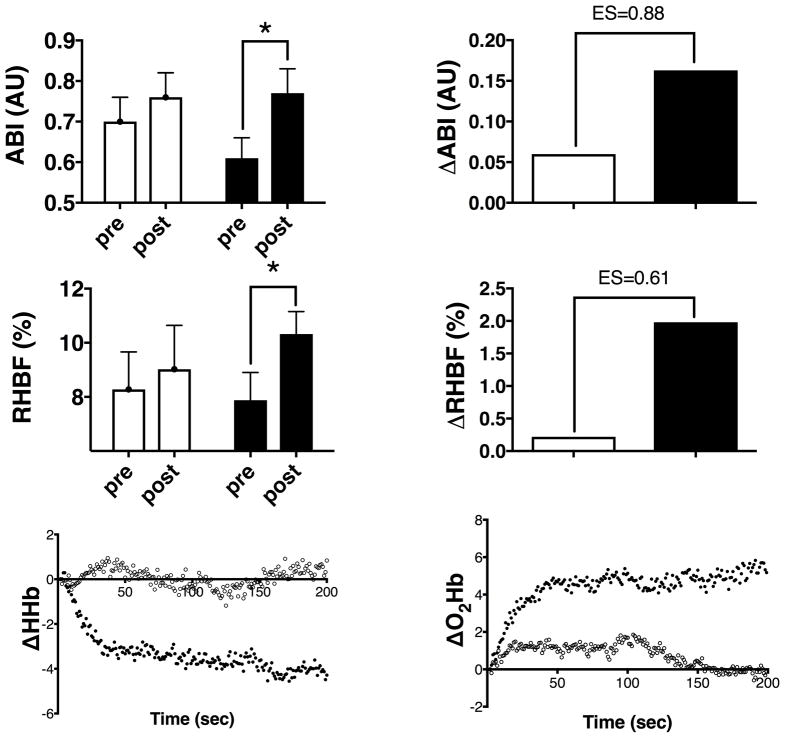
Figure 3.
(left) raw data and (right) group changes for (upper panels) Ankle Brachial Index (ABI-arbitrary units); (middle panels) Reactive Hyperemic Blood Flow (RHBF-ml/min/100mltissue or %). Lower panels show the group average changes in NIRS spectra from pre to post treatment (left) deoxy-haemoglobin and (right) oxy-haemoglobin.
EX+PL (clear bars/circles) or EX+BR (black bars/circles). *=p<0.05, **=p<0.01 within treatment

