
Figure 5. Enhanced atherosclerosis in ApoE/BA-PPARγ DKO mice.
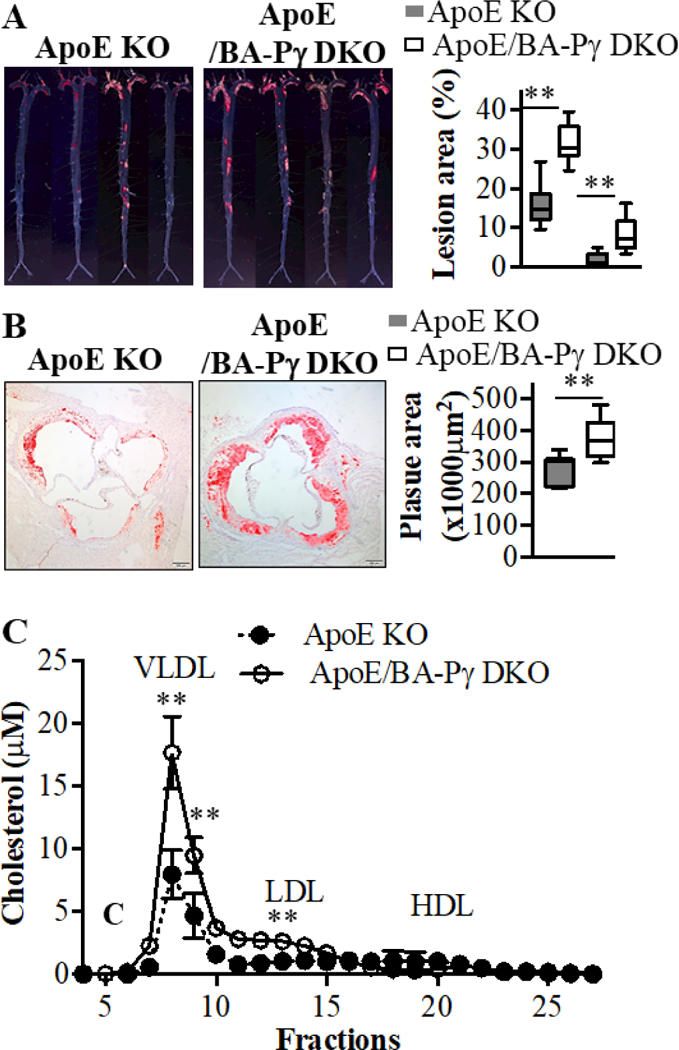
Eight-weeks-old male ApoE KO and ApoE/BA-PPARγ DKO mice were fed a high cholesterol diet for 3 months. (A). Representative en face Oil Red O staining showing atherosclerotic lesions in the whole aortic trees (left) in ApoE and ApoE/BA-PPARγ DKO mice. Quantitative analysis of the ratio of en face atherosclerotic lesion area in the thoracic aorta (TA) and abdominal aorta (AA). n=12 in the ApoE KO group, n=10 in the ApoE/BA-PPARγ DKO group. Student t-test for TA and AA, respectively, **p<0.01 vs ApoE KO. (B). Representative Oil Red O staining showing atherosclerotic lesions in the aortic root (left) and corresponding quantitative analysis (right). n=12 in ApoE KO group, n=10 in ApoE/BA-PPARγ DKO group. Student t-test, **p<0.01 vs ApoE KO. (C). Plasma lipid profile from ApoE KO or ApoE/BA-PPARγ DKO mice was analyzed by FPLC (fractions 1 to 30) and the cholesterol levels in each fraction were measured with a cholesterol fluorometric assay kit. Plasma from 12 ApoE KO and 10 ApoE/BA-PPARγ DKO mice were pooled into 3 samples, respectively. Data shown as mean ± SD. Student t-test, *p<0.05 vs ApoE KO, **p<0.01 vs ApoE KO.