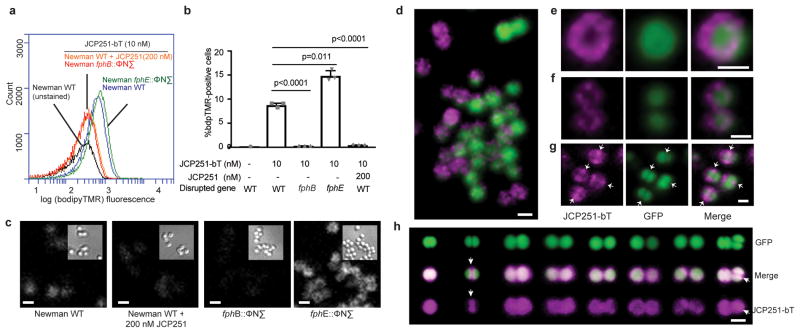
Fig. 5. Imaging of FphB-activity using the fluorescent ABP JCP251-bT.
a) Flow cytometry plot of levels of JCP251-bT probe fluorescence in S. aureus Newman WT, fphB:: ϕNΣ and fphE:: ϕNΣ strains treated with FphB-inhibitor JCP251 or vehicle prior to labeling with JCP251-bT during exponential growth. b) Plot of percentage of cells within the BT-positive gate (see gating strategy in Fig. S8). Graph shows means ± SD of 3 biologically independent samples, indicated p-values were calculated by unpaired, two-tailed Student’s t-test. c) Confocal micrographs of indicated S. aureus strains labeled with 10 nM JCP251-bT. bT-fluorescence is depicted in white, insets show differential interference contrast (DIC) images. d) 3-d reconstruction of a series of confocal images of S. aureus Newman-GFP labelled with 10 nM JCP251-bT. GFP-fluorescence: green, bT-fluorescence: purple. e,f) Confocal micrographs of S. aureus Newman-GFP cell labeled with 10 nM JCP251-bT during exponential phase. g) Confocal micrograph of dividing S. aureus Newman-GFP labelled with 10 nM JCP251-bT during stationary phase. Arrows indicate division septum plane. h) 3-d reconstructions of confocal image series of S. aureus Newman-GFP cells labeled with 10 nM JCP251-bT during stationary phase. Examples of cells in different stages of cell division are shown. Enriched JCP251-bT labeling of the division septum is marked by white arrows. All scale bars: 1 μm. All experiments were repeated twice with similar results.

