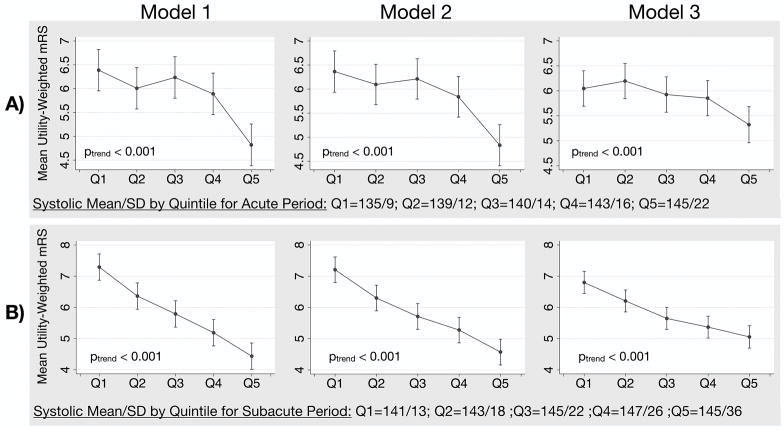
Figure 1.
Mean utility-weighted mRS with 95% CI by quintiles of increasing SD for patients in the A) acute and B) subacute period. Lower utility-weighted mRS values represent a worse neurologic outcome.
*Model 1 = unadjusted, Model 2 = adjusted for patient age, sex, and treatment arm, Model 3 = adjusted for age, ICH volume (mL), intraventricular hemorrhage, location of ICH, NIH stroke scale, intraventricular catheter, premorbid antihypertensive medication.

