
Figure 1.
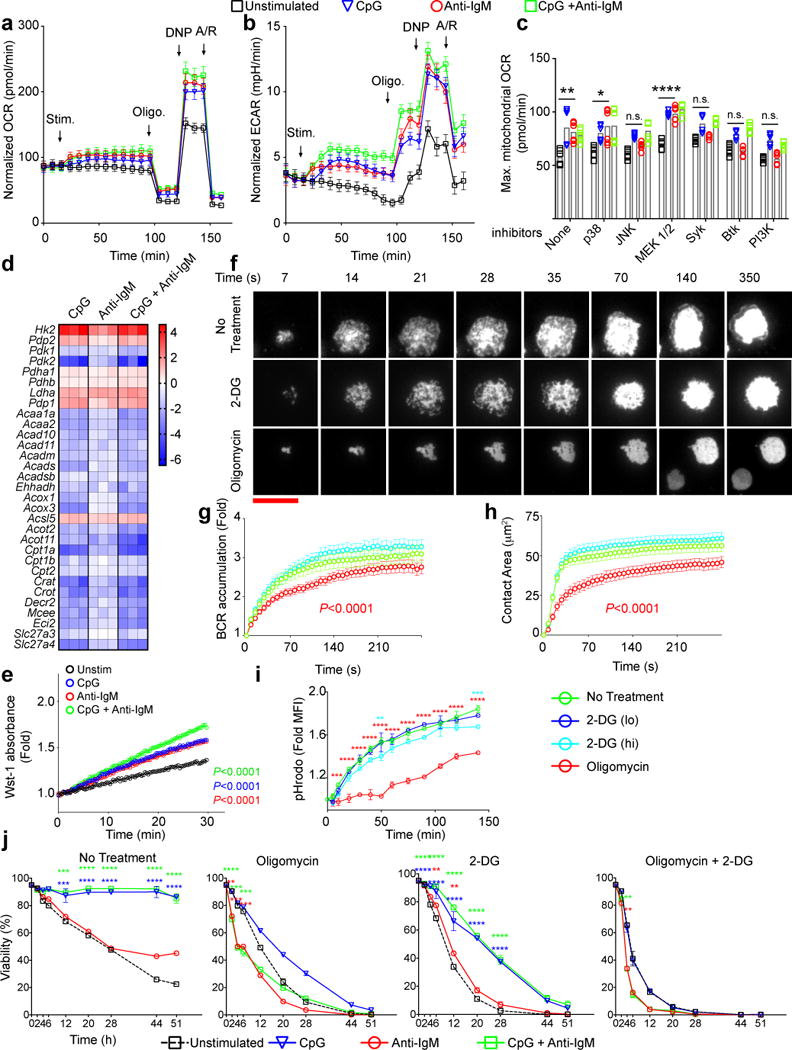
Similar metabolic changes occur immediately following B cell stimulation through either BCR or TLR9. a,b) Changes in Oxygen Consumption Rates (OCR) (a) and Extra Cellular Acidification Rates (ECAR) (b) were measured in real time for B cells stimulated with CpG (1 μM) and/or anti-IgM (5 μg/ml) or unstimulated. Arrows indicate the time points stimulants, oligomycin, DNP and antimycin/rotenone (A/R) were added to the wells. The data are pooled from 10 individual samples acquired in three independent experiments. Symbols and error bars represent the mean and standard error of the mean respectively. c) Maximum OCR levels following addition of 2,4-DNP were measured in B cell cultures in which the indicated inhibitors were added immediately after the stimulants. Bars indicate mean of ten individual samples, shown by symbols, pooled from two experiments. d) Heat maps show the log2 scale fold change in expression levels of a set of genes involved in glucose or fatty acid metabolism from RNA seq data16 of purified mouse splenic B cells that were cultured in media alone or media containing CpG (1 μM) and/or anti-IgM (5 μg/ml) in triplicates for 4h. e) Quantification of PDH activity in B cells following 6h in culture in media alone (unstimulated) or in media containing CpG alone, anti-IgM alone or both using colorimetric assay through Wst-1 reporter dye absorbance. f) HEL-specific MD4 B cells labeled with DyLight549-Fab anti-IgM to allow imaging of the BCRs were placed on HEL-containing PLBs without metabolic inhibitors (No Treatment) or with either 2-DG (55 mM) or Oligomycin (6 μM) and live cell time-lapse TIRF images were acquired for 30 min at 37°C. Representative TIRF images are shown. (scale bar = 10 μm) g) BCR accumulation in the contact area of the B cell with the HEL-PLB presented as the fold increase in BCR MFI above background at each time point. h) The contact area of the B cell with the HEL-PLB. Statistically significant decrease from unstimulated B cells are shown with a P value in the color of the symbol. i) HEL-specific B cells from MD4 mice were incubated with pHrodo-conjugated-HEL on ice, warmed to 37 °C in the presence or absence of 2-DG (lo=11mM, hi=55 mM) or Oligomycin (6 μM). Fold changes in pHrodo MFI compared to the initial time points are shown. Symbols and error bars refer to the mean of three replicates and standard deviation respectively. Data are representative of three independent experiments. j) Purified mouse splenic B cells were incubated in media alone or in media containing CpG (1 μM) and/or anti-IgM (5 μg/ml) in the presence or absence of 2-DG (11 nM) and/or Oligomycin (6 μM). Cell viability determined by staining with Live/Dead marker by flow cytometry is given as a function of time. Symbols and error bars refer to the mean of six replicates and standard error respectively. Data are pooled from two independent experiments. For all panels data points that are significantly different from the unstimulated (Panels a,b,g) or no-inhibitor conditions (Panels c,g,h,i,j) are shown with color-coded asterisks or as adjusted p values. (Panels i,j: two way ANOVA with Dunnet’s adjustment; Panel c: one way ANOVA with Tukey’s adjustment, Panel e: linear regression, Panels g,h: cubic regression with Bonferroni’s adjustment) (P>0.05 = n.s.; 0.01 <P ≤0.05 = *;0.001 <P ≤0.01 = **; 0.0001 <P ≤0.001 = ***; P ≤0.0001= ****)