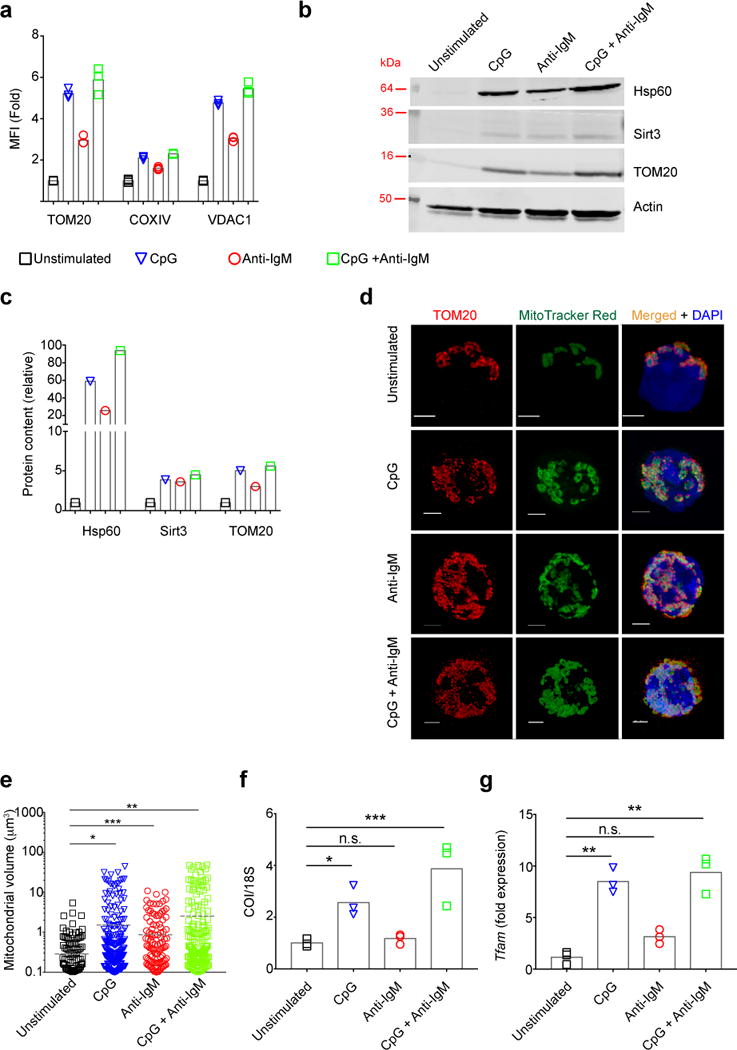
Figure 3.

Increases in mitochondrial mass in response to activation through the BCR and/or TLR9. a) Purified B cells were stimulated with CpG (1 μM) and/or anti-IgM (5 μg/ml) or left unstimulated for 24h and stained with Live/Dead marker, fixed, permeabilized and stained with antibodies specific for the mitochondrial markers: TOM20; COXIV; and VDAC1. MFI levels quantified by flow cytometry are shown. Data represent three independent experiments each carried out with three replicates. Bars represent mean. b,c) B cells cultured in vitro for 24 h as in (a) were stained with Live/Dead marker and viable B cells were FACS sorted and lysates from equal number of cells were analyzed by immunoblot for: Hsp60; Sirt3, TOM20 and actin. The immunoblot was cropped guided by the appropriate molecular weight markers. Representative immunoblot (b) and quantification of the blot relative to actin (c) are given. Data represent three independent experiments. d,e) Purified mouse splenic B cells were cultured in vitro for 24 h in media containing CpG (1 μM) and/or anti-IgM (5 μg/ml), stained with Live/Dead marker and MitoTracker Red, washed and plated on poly-L-lysine coated coverslips. Cells were fixed, permeabilized and stained with TOM20-specific antibodies and DAPI and imaged by STED microscopy. Representative microscope images (d) and quantification of mitochondrial volume for each stimulation condition (e) are shown. Scale bar = 2 μm. Data represent two independent experiments. Images of at least 30 viable cells per experiment were analyzed for each condition. Dashed lines represent the mean values. f,g) Purified B cells cultured in vitro for 24 h as in (a) were harvested and total DNA and RNA were isolated. The relative levels of COI DNA to 18S DNA (f) and TFAM gene expressions compared to unstimulated condition were quantified by qPCR (g). Data represent three independent experiments each of which were carried out in triplicates. Bars represent mean. (P>0.05 = n.s.; 0.01 <P ≤0.05 = *;0.001 <P ≤0.01 = **; 0.0001 <P ≤0.001 = ***; P ≤0.0001= ****) (Panels a,f,g: One Way ANOVA with Tukey’s adjustment; Panel e: Mann-Withney test:).
