
Figure 4.
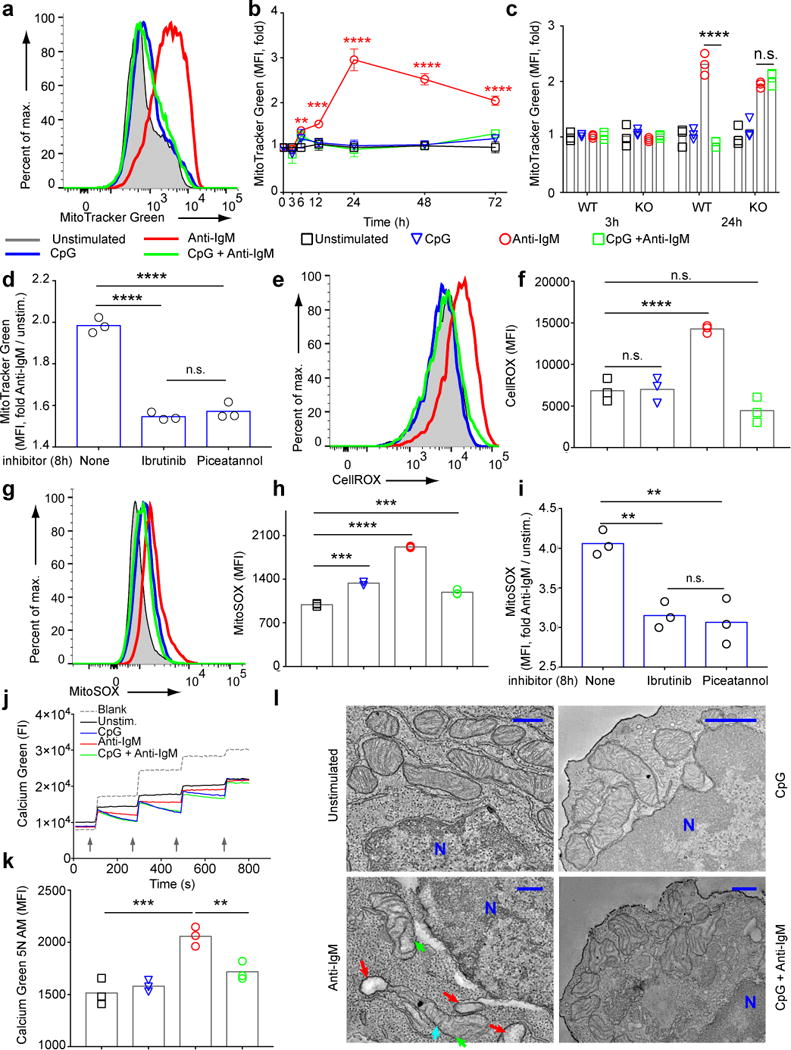
B cells stimulated only through their BCRs in vitro show mitochondrial dysfunction. a,b) Purified B cells were stimulated with CpG (1 μM) and/or anti-IgM (5 μg/ml) or left unstimulated. (a) Flow cytometry plots showing MitoTracker Green staining in the live B cell gate at 24 h post stimulation and (b) quantification of the fold change in MitoTracker Green MFI compared to unstained cells over the course of 72 h culture in vitro are shown. Symbols represent the means of each triplicate and error bars indicate SD. Data represent more than three independent experiments. c) B cells purified from WT and TLR9 KO mice and cultured as in (a) were stained with MitoTracker Green and Live/Dead at 3 h and 24 h post stimulation. Fold changes in MFI are shown. Bars indicate the mean values and error bars the SD of triplicate cultures. Data are representative of three independent experiments. d) B cells were cultured in media containing anti-IgM in the presence or absence of the Btk inhibitor Ibrutinib (1 μM) or the Syk inhibitor Piceatannol (5 μM) added to cultures 8 h post stimulation. Cells were incubated for an additional 16 h, harvested and analyzed for MitoTracker Green FI at 24 h. Fold MFI levels are shown. e-h) Purified B cells were cultured in vitro in the presence of CpG (1 μM) and/or anti-IgM (5 μg/ml) for 24 h. Levels of CellROX (e,f) and MitoSOX (g-i) staining at 24 h are shown as representative flow cytometry plots (e,g) and as the mean and SD of the MFI of triplicate samples (f,h). Each experiment was carried out at least three times with three samples per condition. i) B cells were cultured as in (d) and the fold MFI of MitoSOX staining determined by flow cytometry. j) Mitochondrial calcium uptake was measured in viable B cells purified following 24 h culture in media containing CpG and/or anti-IgM. Cells were pulsed four times with CaCl2 (20 μM) (indicated with arrow heads) and changes in Calcium Green 5N were measured in real time. Data represent three independent experiments. k) B cells were stimulated for 24 h in media containing CpG and/or anti-IgM, harvested and stained with Live/Dead dye and Calcium Green 5N AM to measure intracellular calcium accumulation in viable cells. Bars represent the mean. The experiment was repeated more than three times with at least three replicates per condition. l) B cells were cultured for 24 h in media containing CpG and/or anti-IgM, harvested, fixed and imaged by TEM. Two independent sets of samples were analyzed and at least 10 viable cells per condition were imaged. Swollen mitochondria (red arrow heads), vesicular swollen mitochondria (green arrow heads) and blunted cristae (cyan arrow heads) are shown. N indicates the nucleus. Scale bar = 100 μm. (P>0.05 = n.s.; 0.001 <P ≤0.01 = **; 0.0001 <P ≤0.001 = ***; P ≤0.0001= ****) (Panel b: Two way ANOVA with Dunnet’s adjustment; Panels d,f,i,k: One way ANOVA with Tukey’s adjustment).