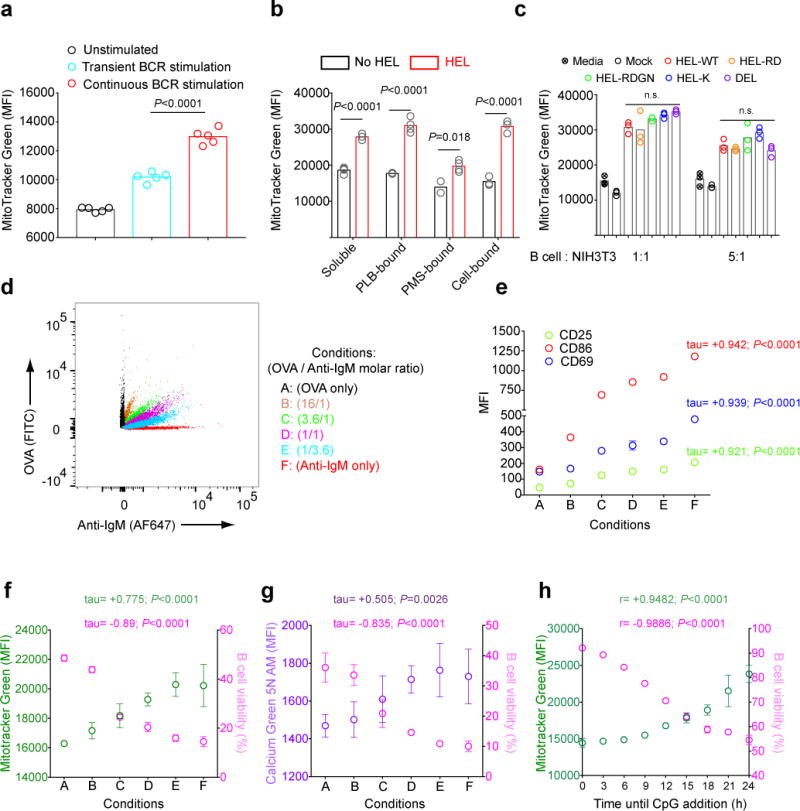
Figure 6.

Antigen-induced mitochondrial dysfunction in B cells correlates with the strength and duration of the BCR stimulation a) Purified B cells were incubated on ice in media alone or in media containing anti-IgM (10 μg/ml), washed and resuspended in either media alone or in media containing anti-IgM (10 μg/ml). Cells were warmed to 37°C, cultured for 24 h in vitro. Live cells were obtained by FACS sorting and stained with MitoTracker Green. MFIs of MitoTracker Green in viable B cells are shown. Bars represent mean values and circles represent individual samples. b) HEL-specific B cells from MD4 mice were unstimulated or stimulated for 24 h with HEL in the following forms: soluble (1 μg/ml); PLB-bound; PMS-bound or expressed on the surface of NIH3T3 cells (cell-bound). The B cell MitoTracker Green MFI was measured by flow cytometry. Bars represent mean values. Data represent two independent experiments with three replicates. c) HEL-specific B cells purified from MD4 mice were co-cultured with untransfected NIH3T3 cells (mock) or NIH3T3 cells stably expressing the indicated proteins at cell ratios of 1:1 or 5:1 for 24 h and MitoTracker Green MFI of B cells measured by flow cytometry. Bars indicate mean values. Results are representative of two experiments. d-g) Biotinylated anti-IgM and OVA were mixed at different molar ratios and incubated with streptavidin coated beads (d). Beads were washed and the amounts of OVA versus anti-IgM on the bead surface was determined by flow cytometry using fluorescently labelled antibodies. B cells were incubated with the beads for 24 h in vitro and analyzed for: (e) the expression of the B cell activation markers, CD25, CD86 and CD69; (f) MitoTracker Green staining; (g) Calcium Green 5N AM staining and (f,g) cell viability using Live/Dead stain. Symbols and error bars indicate mean and SD values. Data are representative of three independent experiments each with three replicates per condition. h) B cells were incubated with anti-IgM (5μg/ml) in vitro and CpG was added to cultures at a final concentration of 1 μM at various times after the initiation of the cultures beginning at 3 h. Viability determined by Live/Dead stain and MitoTracker Green MFI were determined at 24 h. Data represent two independent experiments each with three replicates per condition. (P>0.05 = n.s.) (Panel a,c: one way ANOVA with Tukey’s adjustment; Panel b: Welch’s t-test; Panel e-g: Kendall’s tau correlation; Panel h: Pearson’s correlation)
