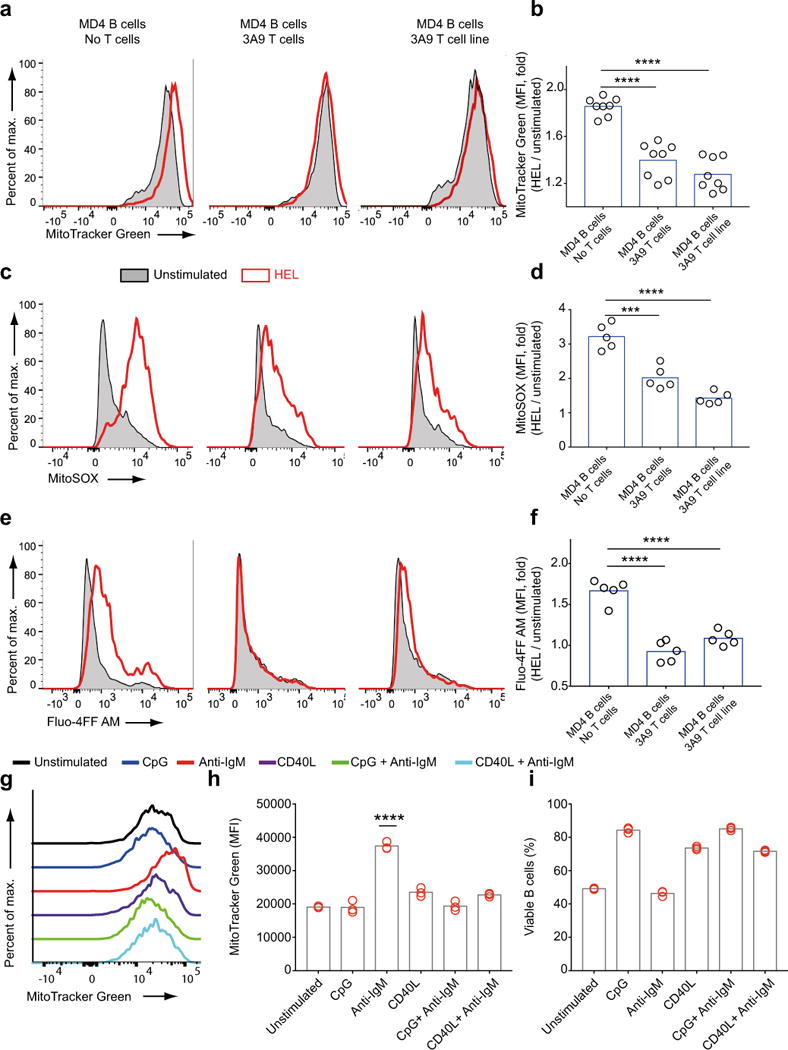
Figure 7.

T cell help prevents antigen-induced mitochondrial dysfunction in B cells a-f) HEL-specific B cells from MD4 mice were cultured alone or with equal numbers of HEL-specific CD4+ T cells harvested from 3A9 mice or HEL-specific 3A9 T cell line in the presence or absence of HEL (1μg/ml) for 24h. Fluorescence of Mitotracker Green (a,b), MitoSOX (c,d) and Fluo-4FF AM (e,f) were measured by flow cytometry Representative flow cytometry plots (a,c,e) and fold change in MFI (b,d,f) are shown. Data was pooled from two independent experiments. Each circle represents a sample and bars indicate the means. g-i) Purified B cells were cultured for 24 h in vitro in media alone or media containing combinations of anti-IgM (5μg/ml), CpG (1 μM) and CD40L (1μg/ml), harvested and analyzed by flow cytometry for MitoTracker Green staining shown in representative plots (g). Bar graphs show changes in MitoTracker Green MFI (h) and B cell viability (i) for each condition. MFI values that are significantly different compared to the unstimulated controls are indicated by asterisks. Data are from more than three independent experiments each carried out with at least three replicates per condition. Bars indicate mean. (0.001 <P ≤0.01 = **; P ≤0.0001= ****) (One way ANOVA with Tukey’s adjustment).
