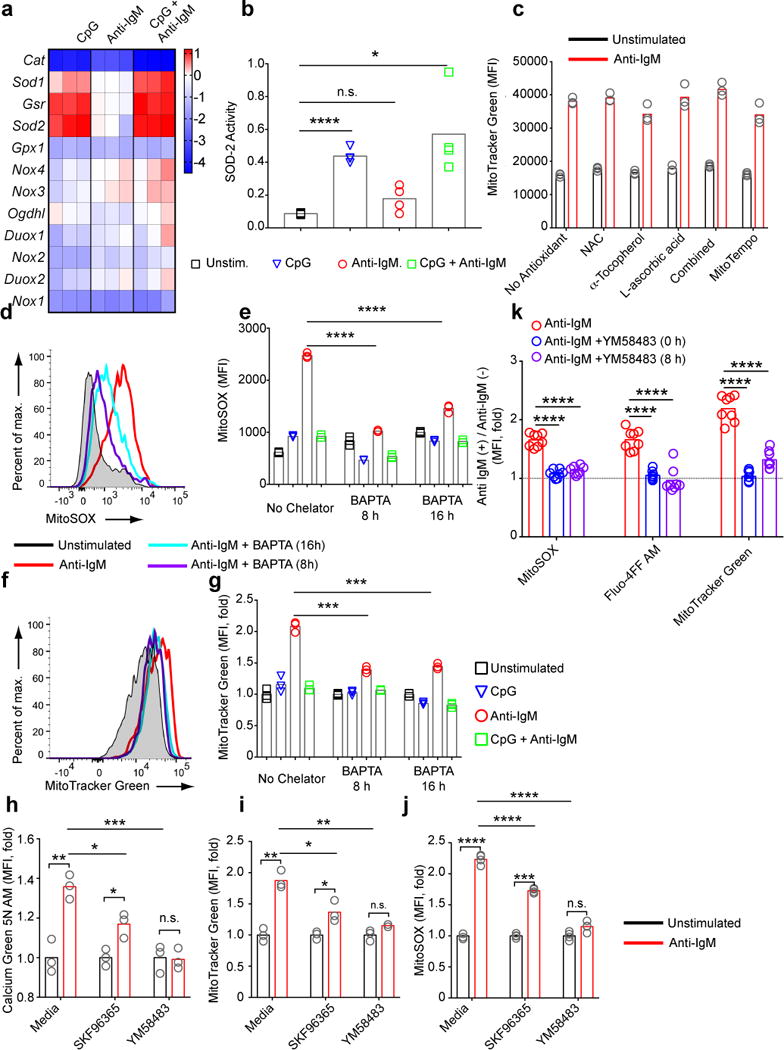
Figure 8.

Antigen-induced mitochondrial dysfunction results from increases in intracellular calcium. a) B cells were cultured in media containing CpG (1 μM) and/or anti-IgM (5 μg/ml) for 4h, harvested and the expression levels of mRNAs encoding oxidants and anti-oxidants were measured using qPCR. The heatmap shows the log2 scale change in the expression of genes in stimulated B cells relative to unstimulated cells. Data represent two independent experiments. b) B cells were cultured in media containing CpG and/or anti-IgM for 24 h. Live cells were FACS sorted after Live/Dead staining and SOD-2 activity was measured in cell lysates using a colorimetric assay. Bars represent mean values. Data represent two independent experiments. c) B cells were cultured in media containing anti-IgM (5 μg/ml) in the presence of the compounds indicated for 24 h. Cells were harvested and analyzed in flow cytometry for MitoTracker Green staining. MFI values for each condition are shown. Bars represent mean. Representative of three independent experiments each of which contained three replicates shown with symbols per condition. d-g) B cells were incubated in vitro in media alone or in media containing CpG (1 μM) and/or anti-IgM (5 μg/ml). BAPTA AM (5 μM) was added to culture either 8 h or 16 h after the initiation of culture. Cells were harvested at 24 h and stained with MitoTracker Green (d,e) or MitoSOX (f,g) and for each, representative flow cytometry plots and bar graphs demonstrating the change in staining levels between conditions are shown. Data represent three independent experiments each carried out with three replicates. h-j) B cells were cultured in media or media containing anti-IgM (5 μg/ml) in the presence or absence of SKF96365 (20 μM) or YM58483 (20 μM) for 24h. Levels of Calcium Green 5N AM (h), MitoTracker Green (i), and MitoSOX (j) staining are shown. Bars represent means. Data are representative of more than three independent experiments each carried out with three replicates per condition. k) Purified mouse splenic B cells were cultured in the presence or absence of anti-IgM (5 μg/ml). YM58483 (20 μM) was added to samples at either 0 or 8 h post stimulation. Samples were stained for MitoSOX, Fluo-4FF AM and MitoTracker Green at 24 h post stimulation and bar graphs show the fold change in MFI of these stains. Each circle represents an individual sample and bars show the mean values. (P>0.05 = n.s.; 0.01 <P ≤0.05 = *;0.001 <P ≤0.01 = **; 0.0001 <P ≤0.001 = ***; P ≤0.0001= ****) (Panels b,e,g,k: one way Anova with Tukey’s adjustment; Panels h-j:Welch’s t-test for pair-wise comparisons and one way Anova with Tukey’s adjustment for multiple comparisons.).
