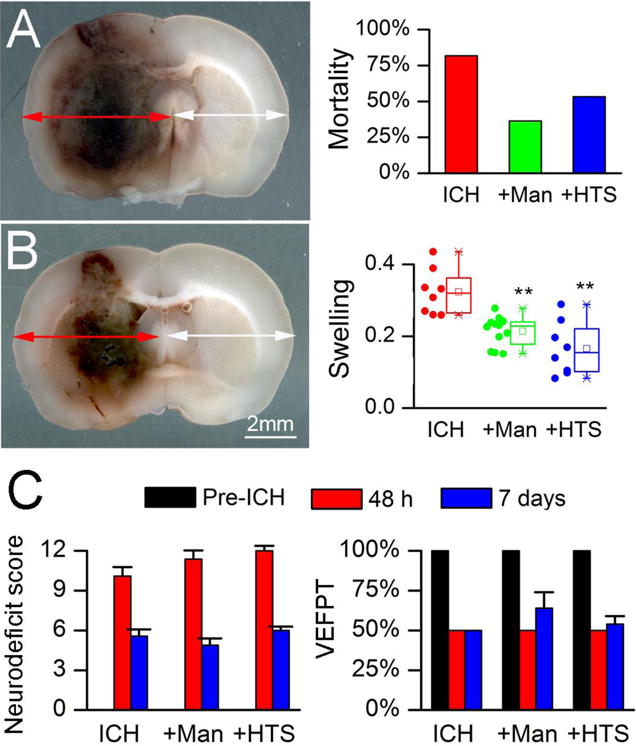
Figure 1. Mannitol and hypertonic saline reduce mortality and brain swelling in ICH models.

A: Image of coronal section of rat brain 48 hours after high-dose collagenase injection (left); note the marked mass effect and midline shift; percent mortality at 48 hours (right) in the high-dose collagenase injection model, in untreated animals (ICH; n=11), and ICH animals treated with mannitol (+Man; n=11) or hypertonic saline (+HTS; n=15); P=0.09. B: Image of coronal section of brain 48 hours after moderate-dose collagenase injection (left); note the presence of less mass effect and less midline shift compared to the high-dose model; swelling at 48 hours of the ipsilateral hemisphere (right), computed as Ai/Ac–1 (see Methods), in the moderate-dose collagenase injection model, in untreated animals (ICH; n=8), and ICH animals treated with IV mannitol (+Man; n=11) or IV hypertonic saline (+HTS; n=8); data are presented as scatter plots, and as box plots showing the mean, median, 1st and 3rd quartiles, and the minimum and maximum; **, P<0.01 with respect to untreated ICH. C: Neurodeficit score and vibrissae-elicited forelimb placing test (VEEPT) at baseline before ICH, and 48 hours and 7 days after ICH, in the moderate-dose collagenase injection model, in untreated animals (ICH; n=11), and ICH animals treated with mannitol (+Man; n=8) or hypertonic saline (+HTS; n=8); in all cases, significant neurological deficits were observed with ICH, and no significant effects of treatment were observed.
