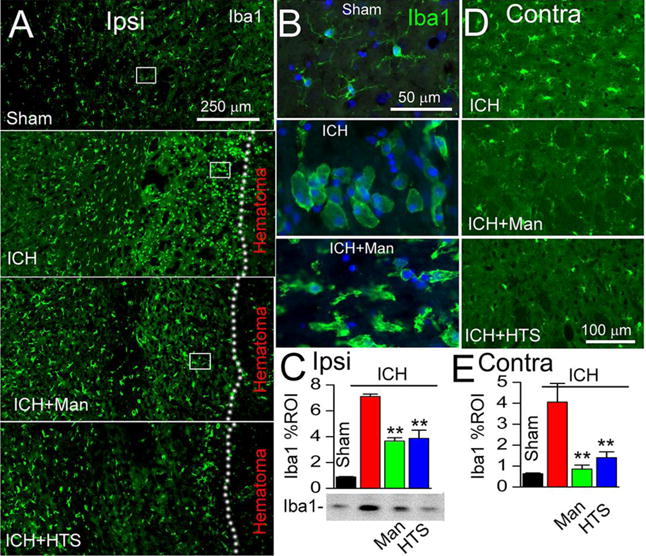
Figure 2. Mannitol and hypertonic saline attenuate microglial activation ipsilateral and contralateral to the ICH.

A–C: Immunolabeling at 48 hours for Iba1 ipsilateral to the ICH (moderate-dose collagenase model), shown at low magnification (A) and high magnification (B; corresponding to rectangles in A), for sham injury, ICH without treatment (ICH), ICH with mannitol treatment (ICH+Man), and ICH with hypertonic saline treatment (ICH+HTS), as indicated; the dotted line demarcates the hematoma from perihematomal tissues; the bar graphs show immunohistochemistry data quantified as percent region of interest (Iba1 % ROI) in the four conditions (C); below the bar graph is shown an immunoblot for Iba1 in the 4 conditions (one animal per lane, representative of 3 animals per condition), corroborating the immunohistochemistry data; **, P<0.01 for treatments compared to no treatment; n=5/group. D,E: Immunolabeling at 48 hours for Iba1 contralateral to the ICH (moderate-dose collagenase model), for ICH without treatment (ICH), ICH with mannitol treatment (ICH+Man), and ICH with hypertonic saline treatment (ICH+HTS), as indicated; the bar graphs show data quantified as percent region of interest in the four conditions (E); **, P<0.01 for treatments compared to no treatment; n=5/group.
