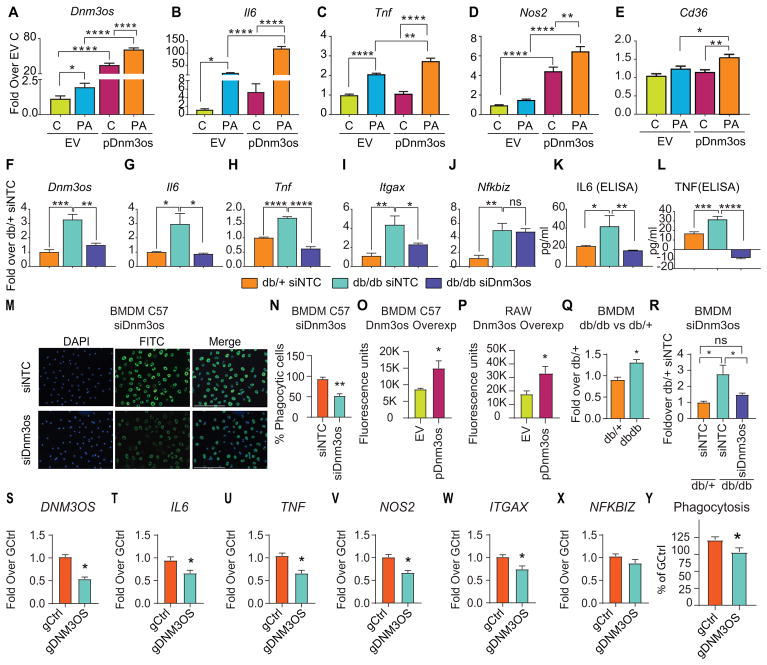
Fig. 4. Dnm3os promotes inflammation and phagocytosis.
A–E. Bar graphs represent the expression of indicated genes in RAW-EV (EV) and RAW-Dnm3os (pDnm3os) macrophages without (C) and with PA (PA) treatment (24 hrs). Results are expressed as fold over untreated RAW-EV (EV C). Mean+SEM; n=5–6, *P<0.05; **P<0.01; ****P<0.0001, one way ANOVA, Tukey’s multiple comparison test. F–L. Gene expression (RT-qPCR) and protein levels (ELISA) in BMDMs transfected with siDnm3os versus non-targeting control (siNTC) in db/db versus db/+ mice. Mean+SEM; n=4–6, * P<0.05, **P<0.01; ***P<0.001; ****P<0.0001, one way ANOVA, Tukey’s multiple comparison test. M–N. Effect of Dnm3os knockdown on phagocytosis. Representative images showing phagocytosis of FITC-labeled fluorescent E. coli bio-particles (green) in BMDMs (C57BL/6 mice) transfected with siDnm3os or control siNTC oligonucleotides (M) and quantification of phagocytosis (N). Mean+SEM; n=3, **P<0.01, unpaired two tailed t-tests. Blue color-DAPI. O–P: Effect of Dnm3os overexpression on phagocytosis in C57BL/6 BMDMs (O); transiently transfected with Dnm3os vector (pDnm3os) versus pcDNA3.1 (EV), and RAW-Dnm3os (pDnm3os) versus RAW-EV (EV) macrophages (P). Phagocytosis assays were performed in 96 wells and fluorescence of internalized particles measured on a plate reader. Mean+SEM *P<0.05; n=4, unpaired two tailed t-tests. Q–R: Phagocytosis assays were performed in BMDMs from db/+ and db/db mice without transfection (Q) or after transfection with siNTC (in db/+ and db/db) or siDnm3os (db/db) BMDMs (R) Mean+SEM; *P<0.05; n=5–6. S–X. Gene expression (S–X) and Phagocytosis (Y) in THP1 macrophages after DNM3OS knockdown using GapmeR (gDNM3OS) versus control GapmeR (gCtrl). Mean+SEM *P<0.05, unpaired t-test (n=6–9 for S-X and 9–10 for Y).

