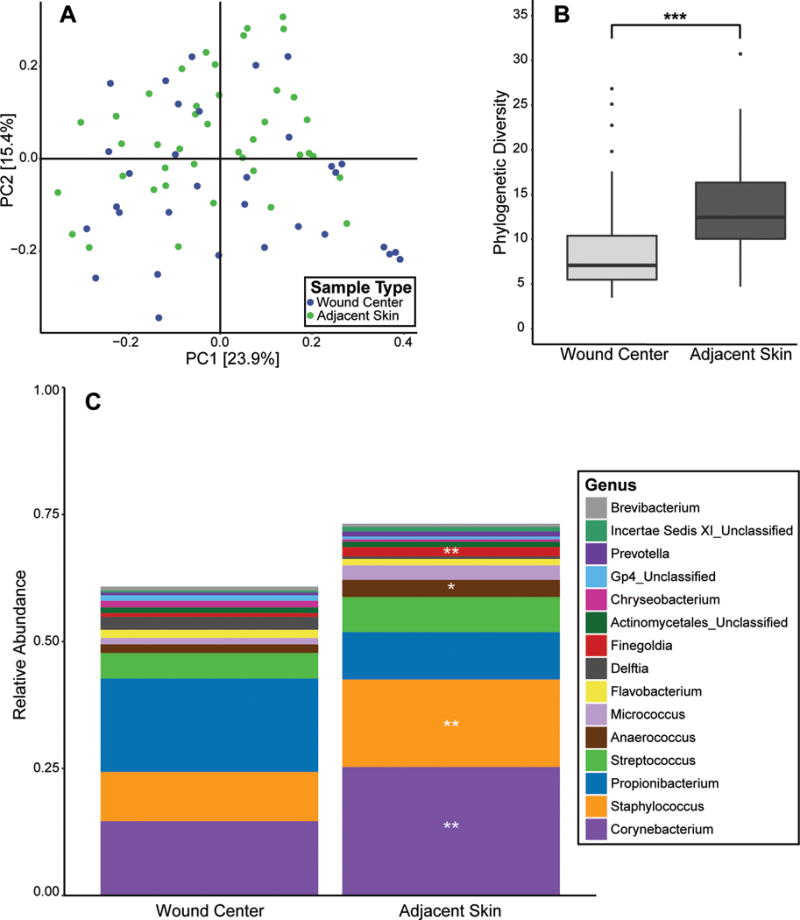
Figure 1. Microbial communities of open fractures and adjacent skin at presentation to the emergency department.

(A) PCoA of the weighted UniFrac inter-sample distances. Each point represents a single patient specimen at the ED time point; one wound sample and one adjacent skin sample from each patient are displayed where data is available. Distance between points (specimens) is indicative of similarity/dissimilarity to other points (specimens). Color indicates sample type (green=skin; blue=wound center). Shown are the first 2 principle coordinates (PC1 and PC2), and percent variance explained by each coordinate is indicated in parentheses by the axis. (B) Comparison of median microbial diversity as measured by Faith’s Phylogenetic diversity metric (y-axis) in wound center and skin specimens (x-axis). A higher metric value indicates higher microbial diversity. Upper and lower box hinges correspond to first and third quartiles, and the distance between these quartiles is defined as the interquartile range (IQR). Lines within the box depict median, and whiskers extend to the highest and lowest values within 1.5 times the IQR. Outliers of the IQR are depicted as dots above or below the whiskers. ***p < 0.005. (C) Average relative abundance/proportion (y-axis) of genus-level taxa in open fracture wounds and adjacent skin (x-axis). Each color represents a different genus-level taxa (identified in the corresponding legend) and its average proportion in the overall sample type indicated. Significant increases are indicated as **q < 0.01; *q < 0.05.
