
Figure 2. Microbial communities of open fractures differs by mechanism of injury at presentation to the ED.
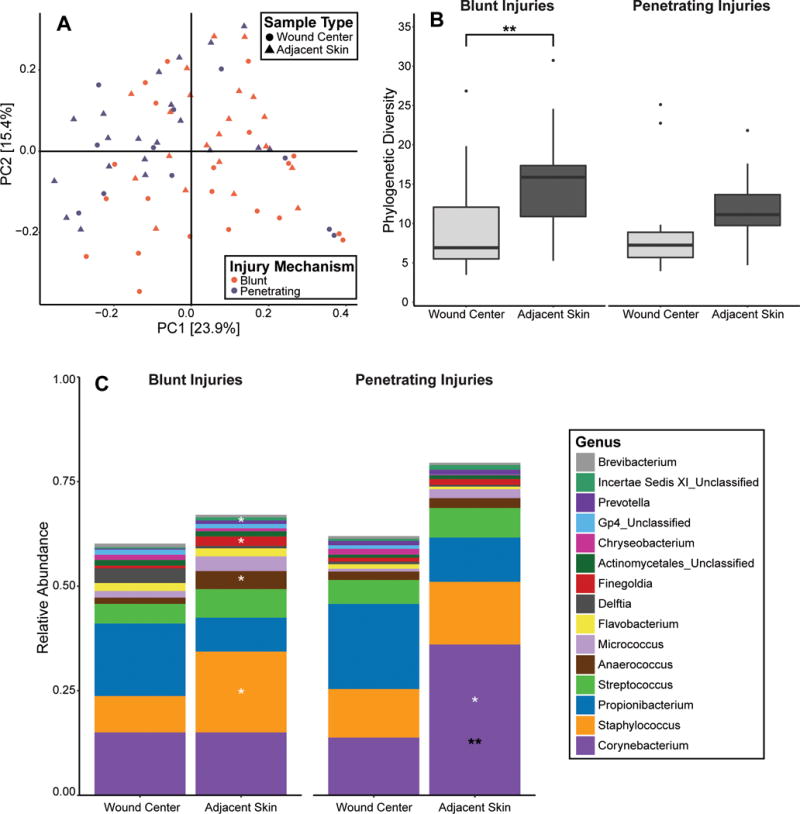
(A) PCoA of the weighted UniFrac inter-sample distances. Each point represents a single patient specimen at the ED time point; one wound sample and one adjacent skin sample from each patient are displayed where data is available. Color indicates mechanism of injury (purple=penetrating; orange=blunt) and shape indicates the sample type (circle=wound center; triangle=adjacent skin). Shown are the first 2 principle coordinates, and percent variance explained by each coordinate is indicated in parentheses by the axis. (B) Alpha diversity, as measured by Faith’s Phylogenetic Diversity index (Y-axis). Blunt and penetrating injuries are depicted on the left and right panels, respectively. Boxplots were generated according to the methods outlined in Figure 1. **p<0.01. (C) Average relative abundance of bacterial genera (y-axis) by sampling site and mechanism of injury. Significant differences in adjacent skin microbiota according to mechanism of injury are indicated by black asterisks. Significant differences between adjacent skin and wound center samples within each injury category are indicated by white asterisks. *q<0.05; **q<0.01