
Figure 2:
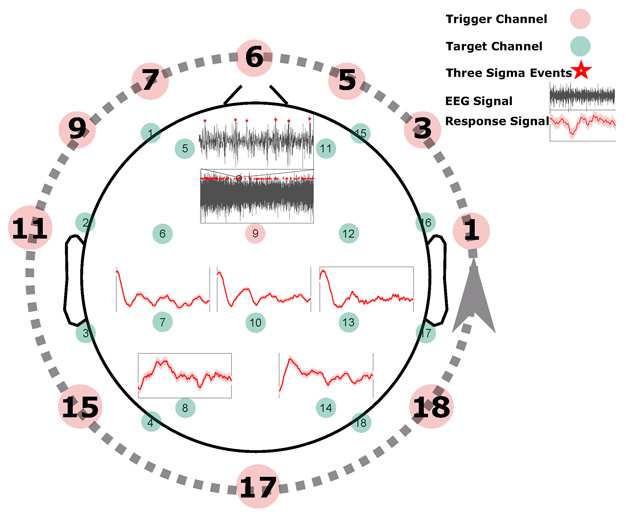
Identifying intrinsic events. To extract the intrinsic events, for each channel selected as a trigger channel (here channel nine), the data points that are more than three standard deviations away from the signal mean in the positive direction (+3σ) are identified (marked by red stars). Next, a window of length w (in this case one second) that follows the identified events is defined, and the corresponding windows in the remaining (target) channels are identified. For each target channel, all the marked windows are averaged to obtain a single response signal for that channel based on the selected trigger channel (shown by red curves here for channels {7, 8, 10, 13, 14}). This process is repeated until each channel is selected as a trigger channel once (represented by a dashed line here), and then the response signals to different trigger channels are averaged to get a typical response signal for each target channel. Finally, the resulting response signals are averaged for each subject group.