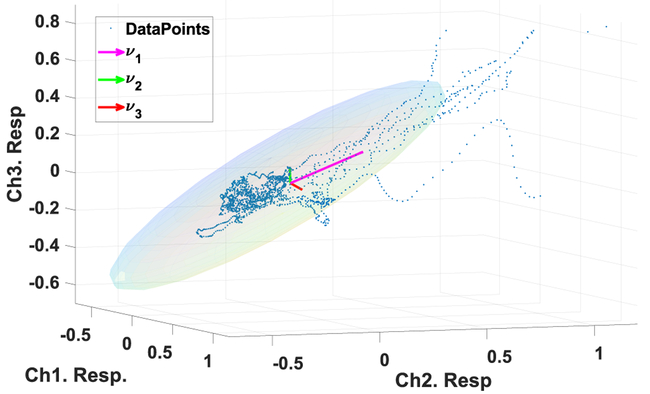
Figure 3:
Obtaining brain state trajectories. To obtain the brain state trajectories PCA is used to reduce the 18-dimensional average responses (here 3-dimensional for visualization purpose) extracted in Section 2.3.1. Each point in this plot shows the averaged responses in three target channels to three sigma events. The three arrows show the direction of eigenvectors with the highest eigenvalues (in this case λ3 < λ2 < λ1), which represent the variance of the data in the direction of the eigenvectors. The ellipsoid is a characterization of the covariance of the data where the angle of the ellipsoid is determined by the interdependency between data points from different channels, and the magnitudes of the ellipsoid axes depend on the variance of the data.

