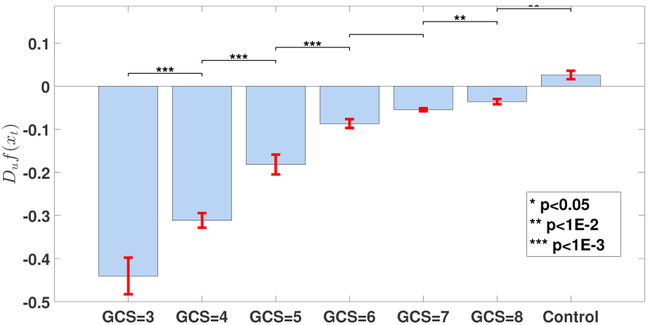
Figure 6:
Comparison of the calculated INRI values for various subject groups. Each bar plot is expressed as mean ± standard error, and the significance level of comparing each consequent pair using multiple comparison test (Tukey-Kramer) of Kruskal-Wallis ranks is shown at the top of each bar plot. The p-values from left to right are p = {4.00e−08, 1.09e−04, 5.50e−07, 1.00e+00, 9.90e−03, 3.62e−03}

