Fig. 2.

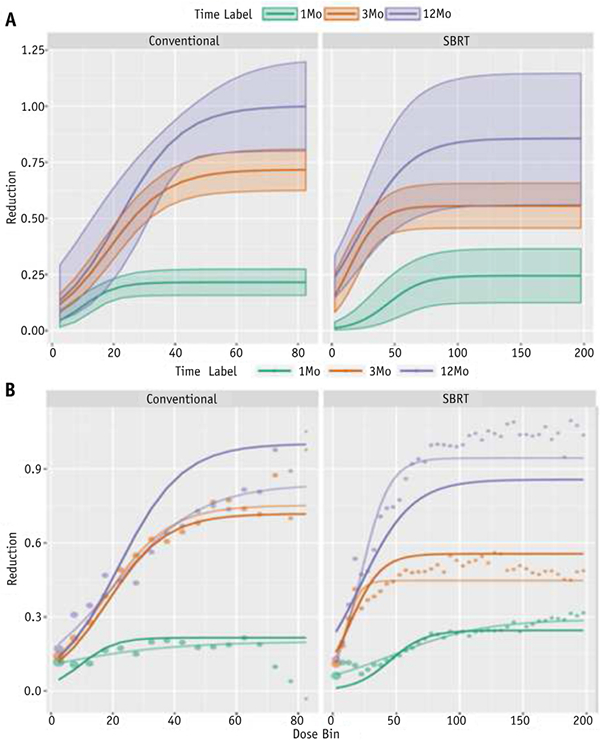
(A) Dose-perfusion response at mid-treatment (Mid-Tx) (green), 3 months post-treatment (3Month Post-Tx) (red), and 1 year post-treatment (1Year Post-Tx) (purple), fit using a patient-specific logistic model. The 95% confidence intervals are represented by the shaded region. (B) Patient-specific logistic model fits (solid lines) compared with the voxel-weighted average data (points) and non-patient-specific logistic model fits (shaded lines). Abbreviations: Conventional Z conventional radiation therapy; SBRT Z stereotactic body radiation therapy. (A color version of this figure is available at www.redjournal.org.)
