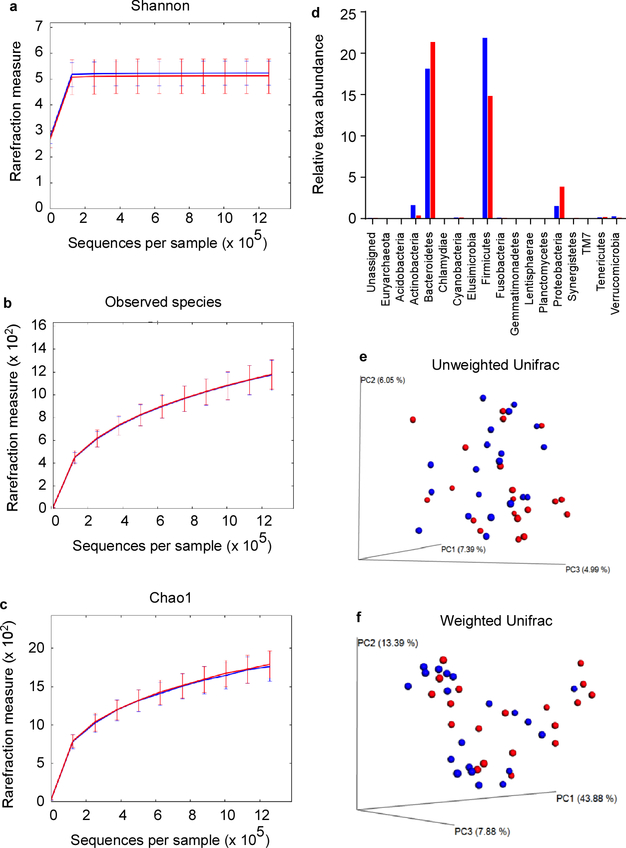
Extended Data Figure 1 |. Microbiome analysis of S. aureus carriers versus non-carriers.
The microbiota of n=20 randomly selected S. aureus carriers (red) and n=20 non-carriers (blue) were analyzed in fecal samples. a-c, Rarefaction curves of 16S rRNA gene sequences. Error bars shown the means ±SD. a, Shannon index. b, Observed species against the number of sequences per sample. c, Chao1 index. d, Relative taxa abundance comparison between S. aureus carriers (red) and non-carriers (blue), e-f, beta diversity, represented by a Principal Coordinate Analysis (PCoA) plot based on unweighted UniFrac (e) and weighted UniFrac metrics (f) for samples from S. aureus carriers (red) and non-carriers (blue).

