
Figure 3. C3aR is important for platelet function.
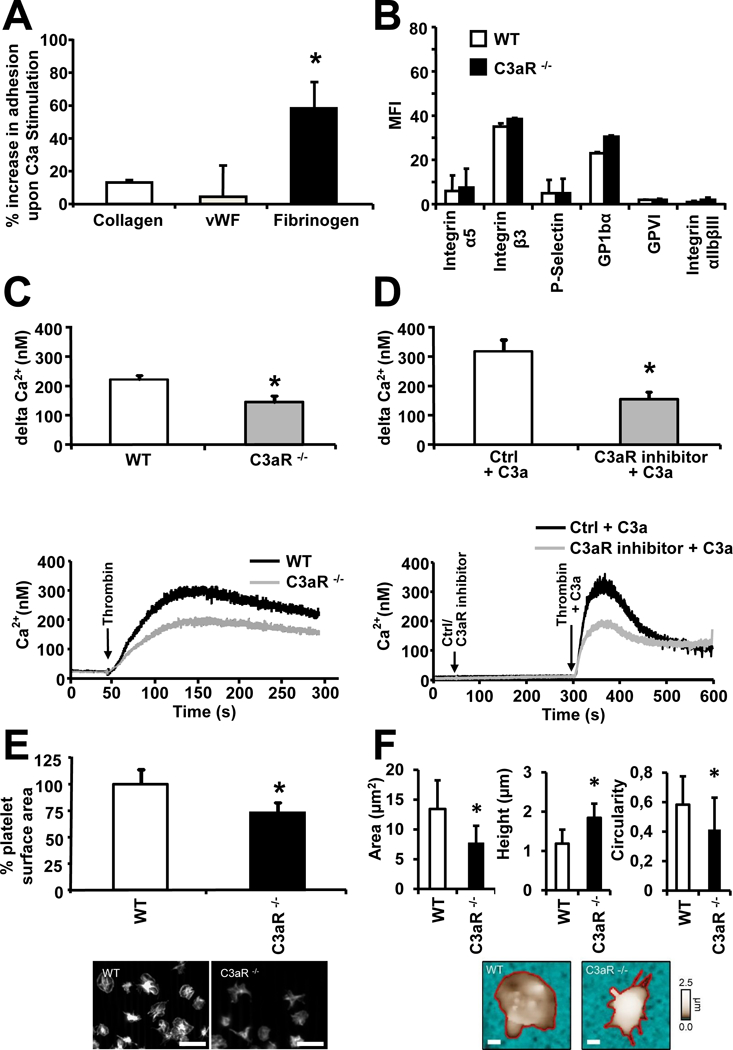
(A) Human isolated platelets were perfused over coverslides coated with different extracellular matrix proteins using a parallel-plate flow chamber. Under flow conditions (shear rates 1700s−1), the increase of adhesion upon stimulation with C3a (4 µM) in comparison to stimulation with control protein was measured. The increase in adhesion onto fibrinogen was significantly stronger in comparison to collagen and vWF. Data represent mean ± SD. n=5. *p<0.05 (B) Whole blood of WT and C3aR−/− mice was fixed with PFA and analyzed for platelet surface receptor expression by flow cytometry. Receptor expression is not altered between the two groups. Data represent mean±SD, n=5. (C, D) Ca2+-influx was analyzed in washed murine WT and C3aR−/− platelets activated with thrombin (0.01 U/ml) (C) or in washed WT platelets, treated with a C3aR Inhibitor (10 µM) or DMSO (Ctrl) and activated with thrombin (0.01 U/ml) +/− C3a (200 nM) (D). The measured 340/380 nm ratio values were converted into nanomolar concentrations of Ca2+. C3aR−/− platelets and C3aR-Inhibitor treated WT platelets show significantly reduced Ca2+ influx compared to WT (and control-treated WT) platelets. Data represent mean ± SD, n=5. *p<0.05 The corresponding curves show measurements representative for all experiments. (E) Isolated WT and C3aR−/− platelets were stimulated with 0.01 U/ml thrombin and allowed to adhere to immobilized fibrinogen, before the spreading area of rhodamin-phalloidin-stained platelets was measured by microscopy. Data represent mean ± SD, n=5. *p<0.05 for C3aR−/− platelets in comparison to platelets isolated from WT mice. scale bars: 10 µm (F) Isolated WT and C3aR−/− platelets were stimulated with 0.01 U/ml thrombin and adhesion to immobilized fibrinogen was analyzed after 30 minutes. Area, height, and circularity of PFA-fixed platelets were analyzed using SICM. Data represent mean ± SD, n = 26 platelets from n=4 independent experiments each. *p<0.05. Lower panel: shown are representative SICM topography images. The cell contour (red) was traced to quantify cell area, height and circularity. Scale bars: 1 µm.