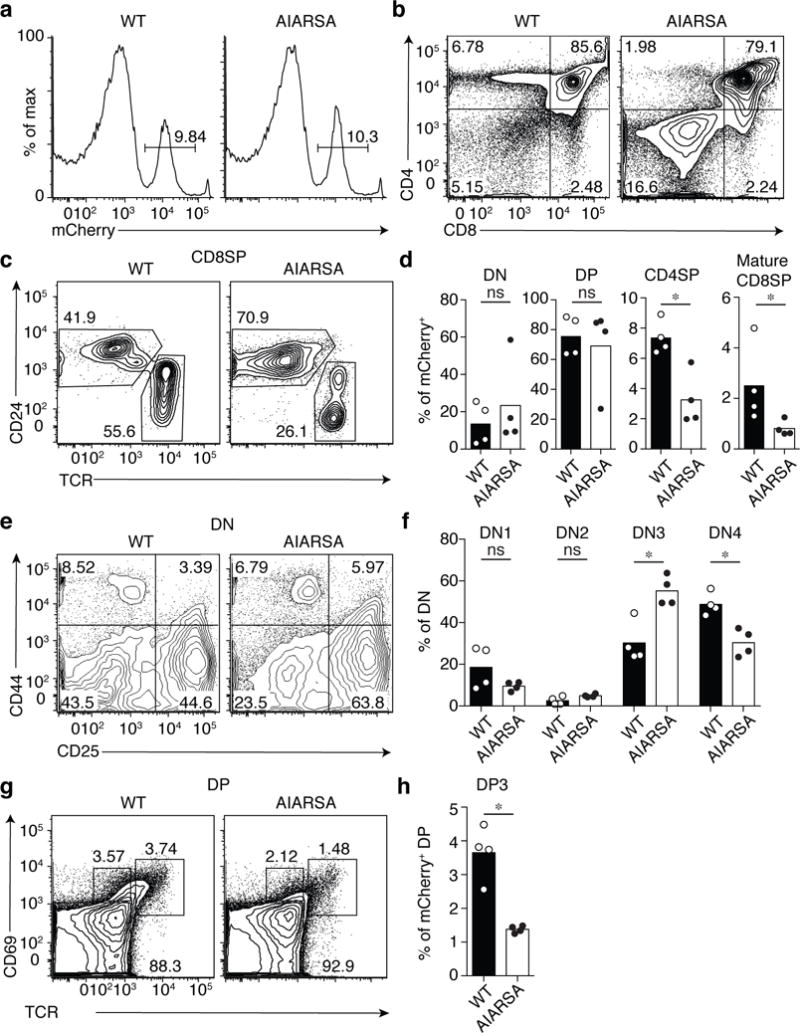
Fig. 3. Ectopic expression of LAT containing the PIPRSP mutant motif, AIARSA, impairs thymocyte β- and positive-selection in vivo.

Flow cytometric analysis of thymocytes from lethally irradiated bone marrow BoyJ (CD45.1+) chimeras reconstituted with CD45.2+ LAT-deficient B6 hematopoietic stem cells transduced with lentiviruses expressing either WT LAT-P2A-mCherry (WT; n = 4 recipients) or mutant AIARSA LAT-P2A-mCherry (AIARSA; n = 4 recipients). Recipient mice were analyzed 6 – 8 weeks later. (a) Representative mCherry expression of thymocytes, gated on CD45.2+ cells. Numbers indicate percentages of mCherry+ cells in each gate. (b) Flow cytometric analysis of CD45.2+ mCherry+ thymocytes. Numbers in each quadrant indicate percent of cells in each. (c) Flow cytometry analysis of CD24 versus TCR expression of CD45.2+ mCherry+ CD8SP thymocytes. (d) Bar graphs representing the frequencies of DN, DP, CD4SP and CD24−TCR+ mature CD8SP thymocytes among CD45.2+ mCherry+ cells. Each symbol represents an individual mouse. Bars indicate the mean± s.d. n = 4 independent animals in two independent experiments. *P = 0.0286; ns, not significant; two-tailed Mann-Whitney test. (e) Flow cytometric analysis of DN1 to DN4 cell development based on CD44 and CD25 expression, gated on CD45.2+ mCherry+ DN thymocytes. (f) Frequency of DN1 (CD4+CD25+), DN2 (CD44+CD25+), DN3 (CD44−CD25+), DN4 (CD44−CD25−) of CD45.2+ mCherry+ DN T cells in each quadrant of (e). Bars indicate the mean± s.d. n = 4 independent animals in two independent experiments. *P = 0.0286; ns, not significant; two-tailed Mann-Whitney test. (g) Flow cytometric analysis of DP progression through thymic positive selection based on CD69 and TCR expression, gated on CD45.2+ mCherry+ DP thymocytes. (h) Frequency of post-selection DP3 (CD69+TCRhi) DP cells. Bars indicate the mean± s.d. n = 4 independent animals in two independent experiments. *P = 0.0286; two-tailed Mann-Whitney test. All data are representative of two independent experiments with similar results.
