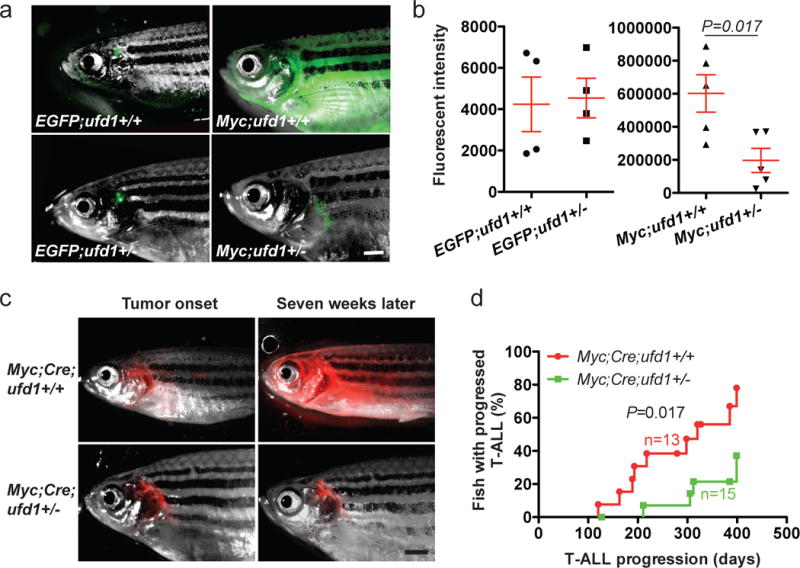
Figure 4. Heterozygous loss of ufd1 significantly decreases MYC-induced T-ALL burden and delays disease progression in zebrafish.

(a) Overlay of brightfield images and EGFP fluorescence of T cells in a control EGFP;ufd1+/+ and EGFP;ufd1+/− fish (123-day-old; left panels), as well as GFP+ tumor cells in a Myc;ufd1+/+ and Myc;ufd1+/− fish (114-day-old; right panels). (b) Fluorescence intensity quantification demonstrated that Myc;ufd1+/− fish had significantly less tumor burden than Myc;ufd1+/+ fish (mean ± SD: 196,720 ± 72,740 vs. 602,086 ± 112,985; P=0.017; n=5 per group; right panel), while there were no difference in thymic fluorescence intensity for EGFP;ufd1+/− versus EGFP;ufd1+/+ fish (mean ± SD: 4,539 ± 955 vs. 4,239 ± 1,319; P=0.86; n=4 per group; left panel). (c) Localized DsRED2-labeled tumors arose in a conditional Myc;Cre;ufd1+/+ (48-day) and Myc;Cre;ufd1+/− fish (57-day); widespread dissemination of T-ALL was seen seven weeks later in Myc;Cre;ufd1+/+ fish, but not in Myc;Cre;ufd1+/− fish. (d) Rates of T-ALL progression indicate that despite a similar tumor onset time, Myc;Cre;ufd1+/− fish (green line) develop widely disseminated T-ALL much slower than Myc;Cre;ufd1+/+ fish (red line; n=15 and 13; respectively). Scale bar for panels (a) and (c) = 1 mM.
