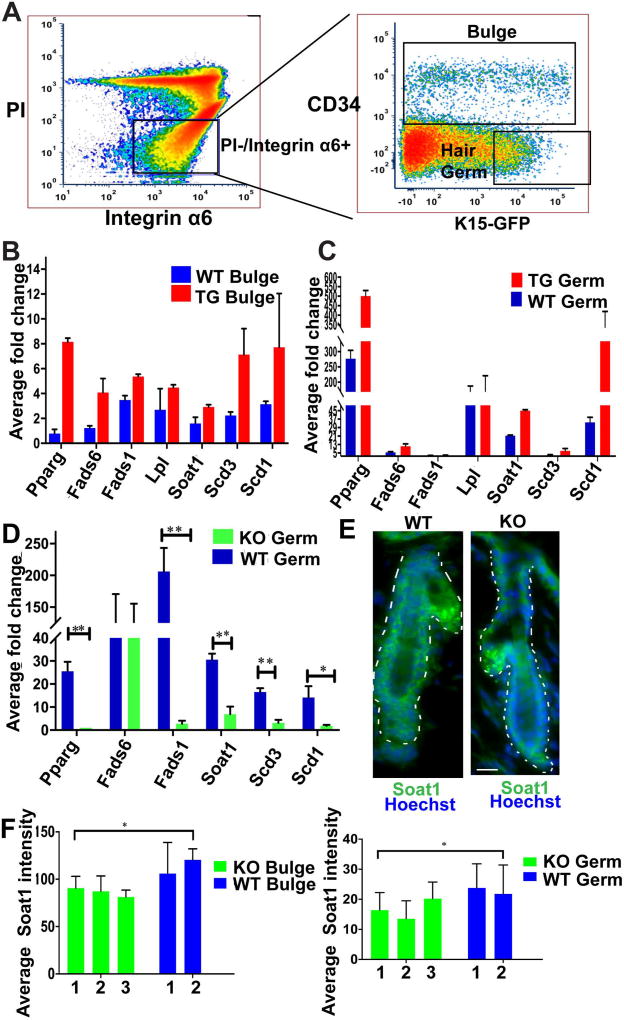
Figure 1. Expression of lipid metabolism genes in mouse skin.
(A) Representative FACS dot plot shows sorting gates to isolate bulge (CD34+/α6 integrin+/GFP+/−) and hair germ (HG) early progenitor cells as (CD34−/α6+/GFP+), as previously characterized (1). The brightest 1/3 of the GFP+ cells were used, to avoid potential cross-contamination between bulge and hair germ populations (1).
(B) qRT-PCR from Runx1 inducible transgenic (TG) FACS sorted bulge cells shows an increase in expression of lipid metabolism genes as compare to WT littermates. (n=2 mice from each genotype).
(C) qRT-PCR from Runx1 inducible transgenic (TG) FACS sorted hair germ (HG) cells shows an increase in expression of lipid metabolism genes as compare to WT littermates. (n=2 mice from each genotype).
(D) qRT-PCR from Runx1 inducible knockout (iKO) FACS sorted HG cells shows a decrease in expression of lipid metabolism genes as compare to WT littermates. (n=3 mice from each genotype, P value throughout all figures that are <0.05 is represented as “*” on the graph and p value <0.005 represented as “**”.
(E) Immunofluorescence staining shows expression of Soat1 (green), Hoechst (blue) in HG and bulge is reduced in the Runx1 KO. Scale bar, 20 µm.
(F) Quantification of Soat1 expression in bulge and HG shows significant decrease upon Runx1 knockout. Numbers at bottom indicate individual mouse ID. (n=40 hair follicles per genotype).

