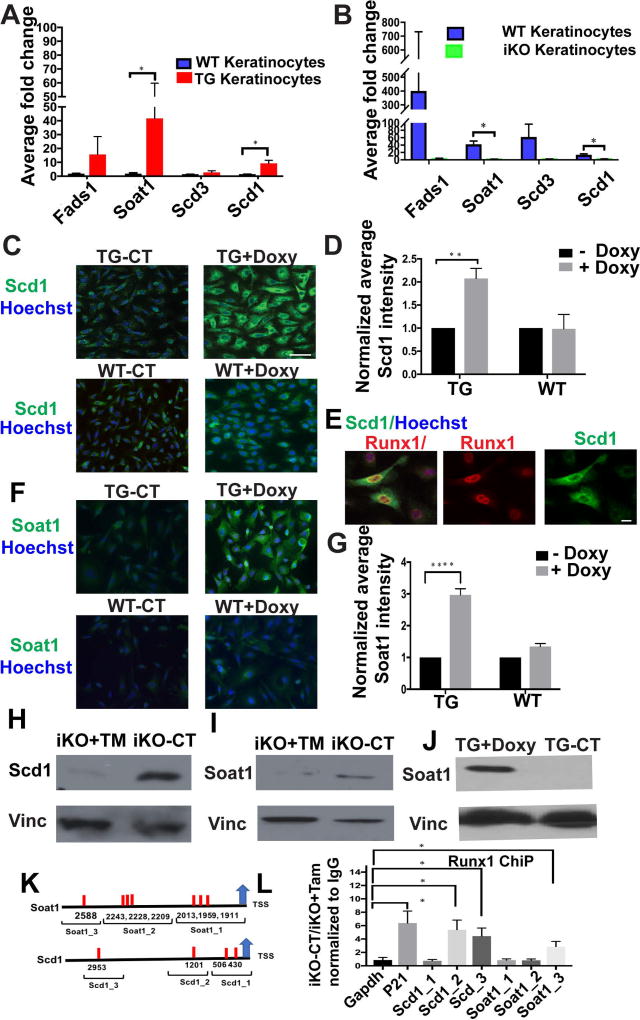
Figure 2. Runx1 dictate the expression of Scd1 and Soat1 in cultured keratinocytes.
(A, B) qRT-PCR validation of mRNA levels for candidate genes in cultured Runx1 inducible knockout (iKO) following 48 hours of 4-OHT and transgenic (TG) keratinocytes following 6 hours of doxycycline relative to WT controls. (n=3 from each represented genotype). Significant p values (<0.05) are shown as *.
(C, F) Immunofluorescence staining of cultured keratinocytes shows expression of Scd1 or Soat1 (green) in response to doxycycline (doxy)-induced Runx1 (TG+Doxy), TG control with no doxy (TG-CT), and WT cells without doxy (WT-CT) ad with doxy (WT+Doxy). Scale bar, 20 µm.
(D, G) Quantification of average Scd1 or Soat1 staining after Runx1 induction (TG+Doxy) when compared with control (TG-CT) and (WT+ Doxy) when compared with no doxy control (WT-CT). (n=3 experiments, ~ 150–200 cells per experiment); normalized against control in each group, average intensity is arbitrary value. P value that are <0.05 is represented as “*” on the graph and P value <0.0001 represented as “****”.
(E) Immunofluorescence staining showing correlation of doxy-induced Runx1 elevation (red) with enhanced Scd1 expression (green). Nuclei (blue) were counterstained with Hoechst. Scale bar, 20 µm.
(H, I) Western blotting showing a decrease of Soat1 and Scd1 protein levels in cultured keratinocytes of Runx1 iKO after 48 hours of 4-OHT treatment, denoted as (TM). Vinculin (Vinc) works as loading control.
(J) Western blotting against vinculin (Vinc) or Soat1 antibodies showing an increase of Soat1 protein in Runx1 TG keratinocytes after 12 hours of doxy-induced Runx1 expression.
(K) Scheme representing ChIP probed regions to cover predicted Runx1 binding sites (red bar) the promoters of Scd1 and Soat1.
(L) ChIP of CT (iKO-CT) and Runx1 KO (iKO+Tam) keratinocytes using Runx1 antibody, P value for pair wise comparisons that are <0.05 is represented as “*” on the graph, (n= 3 independent experiments).

