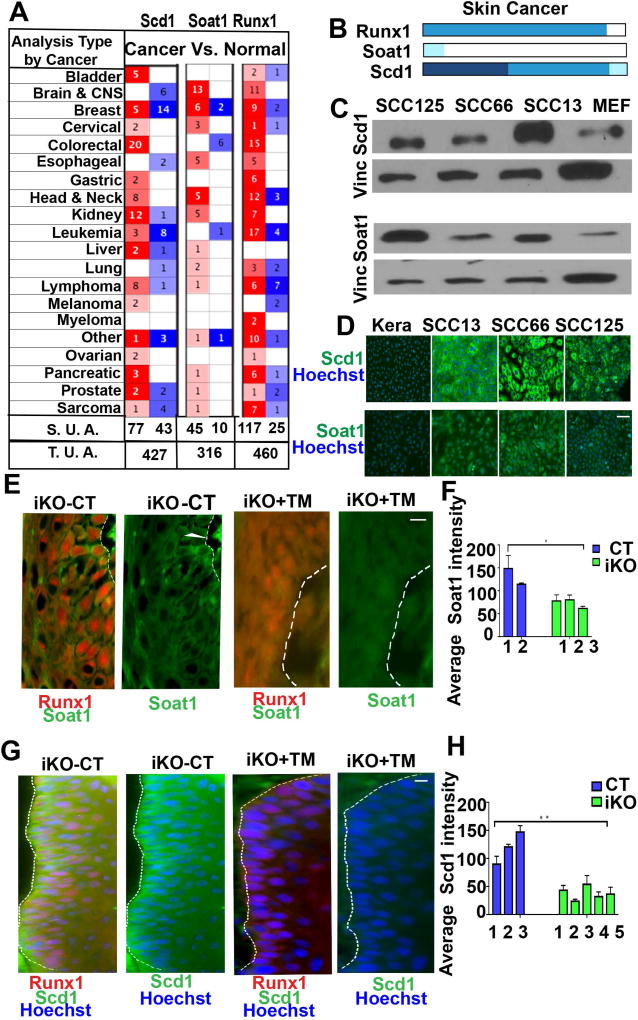
Figure 3. Expression of Scd1 & Soat1 in Squamous Cell Carcinomas.
(A) Table showing the number of significant unique analyses (S. U. A.) and total unique analyses (T. U. A.) using Oncomine data sets curated for cancer versus normal tissue pointing to up (red) or down (blue) regulation of Runx1, Scd1, and Soat1 in a variety of cancers. Number in each cell corresponds to number of analysis that meets the threshold of top 10% of all overrepresented genes in tumors.
(B) Human Protein Atlas analyses showing expression profiles of Runx1, Soat1 and Scd1 in skin cancer which comprises tumors samples of squamous cell carcinoma and basal cell carcinoma. Runx1 is expressed in most skin cancer tumors, Soat1 shows low expression, while Scd1 shows moderate to high expression. Darker shades of blue correspond to higher expression.
(C) Western blotting of skin carcinoma (SCC13) and oral carcinomas (SCC66, SCC125) cell lines show elevated levels of Scd1 and Soat1 as compare to mouse embryonic feeders (MEFs) used as controls. Vinculin (Vinc) served as the loading control. Shown is one representative example of 3 independent experiments. (For quantification of data in C&D in repeat experiments see Supplementary Fig. 3)
(D) Immunofluorescence staining of skin squamous cell carcinoma (SCC13) and oral squamous cell carcinomas (SCC66, SCC125) showing Scd1 (green) and Soat1 (green). Note striking Scd1 and Soat1 up-regulation in SCCs as compare to wild type (WT) mouse keratinocytes. Scale bar, 20 µm.
(E–H) Immunofluorescence staining (E, G) and quantifications (F, H) of mouse skin tumors show that Scd1 (green) and Soat1 (green) are highly expressed in WT tumors and are down-regulated in iKO tumors upon loss of Runx1. White line delineates epithelial cell clusters where Scd1 is expressed. Numbers represent tumors derived from different mice. Scale bar, 20 µm. P value that are <0.05 is represented as “*” and P value <0.005 represented as “**” on the graph.

