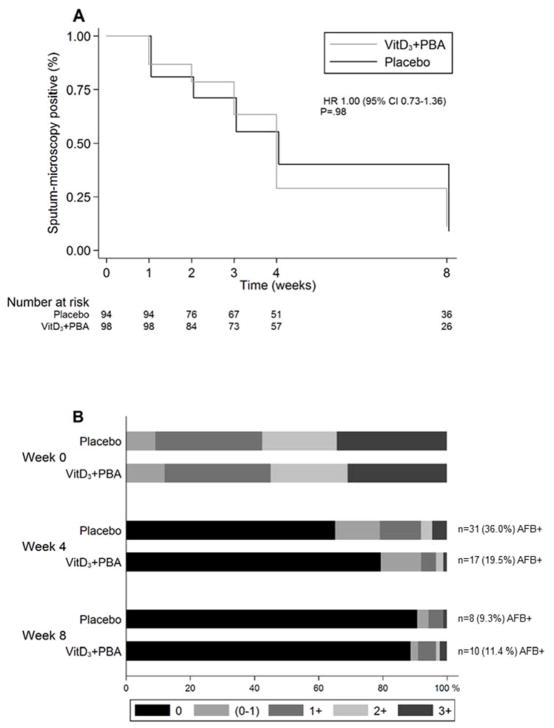
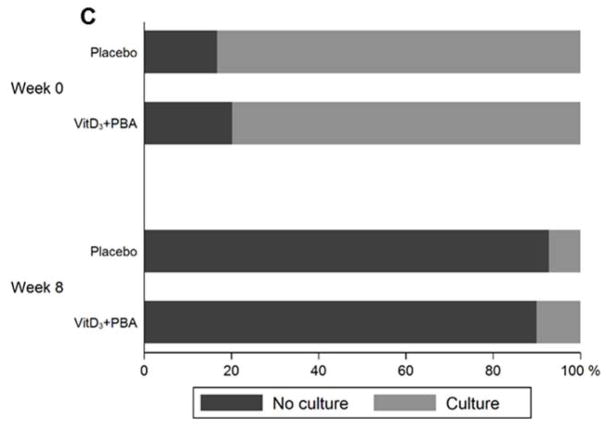
Fig. 3.
Sputum-smear conversion analyses. (a) Longitudinal analysis of time to sputum-smear conversion after initiation of anti-TB chemotherapy in patients who were sputum-microscopy positive at enrolment. Crude data are presented in a Kaplan-Meier curve. The blue line represents placebo while the red line represents vitD3+PBA treatment. The hazard ratio (HR) and 95% CI is shown. (b) AFB-grading among sputum-smear positive TB patients at baseline compared to week 4 and 8 after initiation of anti-TB chemotherapy. AFB-positivity (+) was graded using microscopy as no AFB (negative), scanty (0–1), +1, +2, or +3 AFB. Data are shown in a bar graph with a colour scale from 0 (red) to 3+ (blue) AFB. The numbers and proportion of AFB+ TB patients in the placebo vs vitD3+PBA group at week 4 and 8 are also indicated in the graph. Patients with a negative sputum-smear result at baseline were excluded from the conversion analysis. (c) Sputum-culture conversion among both Mtb-culture positive and negative TB patients at baseline compared to week 8 after initiation of anti-TB chemotherapy. Bar graph showing negative Mtb-culture (red) vs positive Mtb-culture (blue).


